Fig. 6
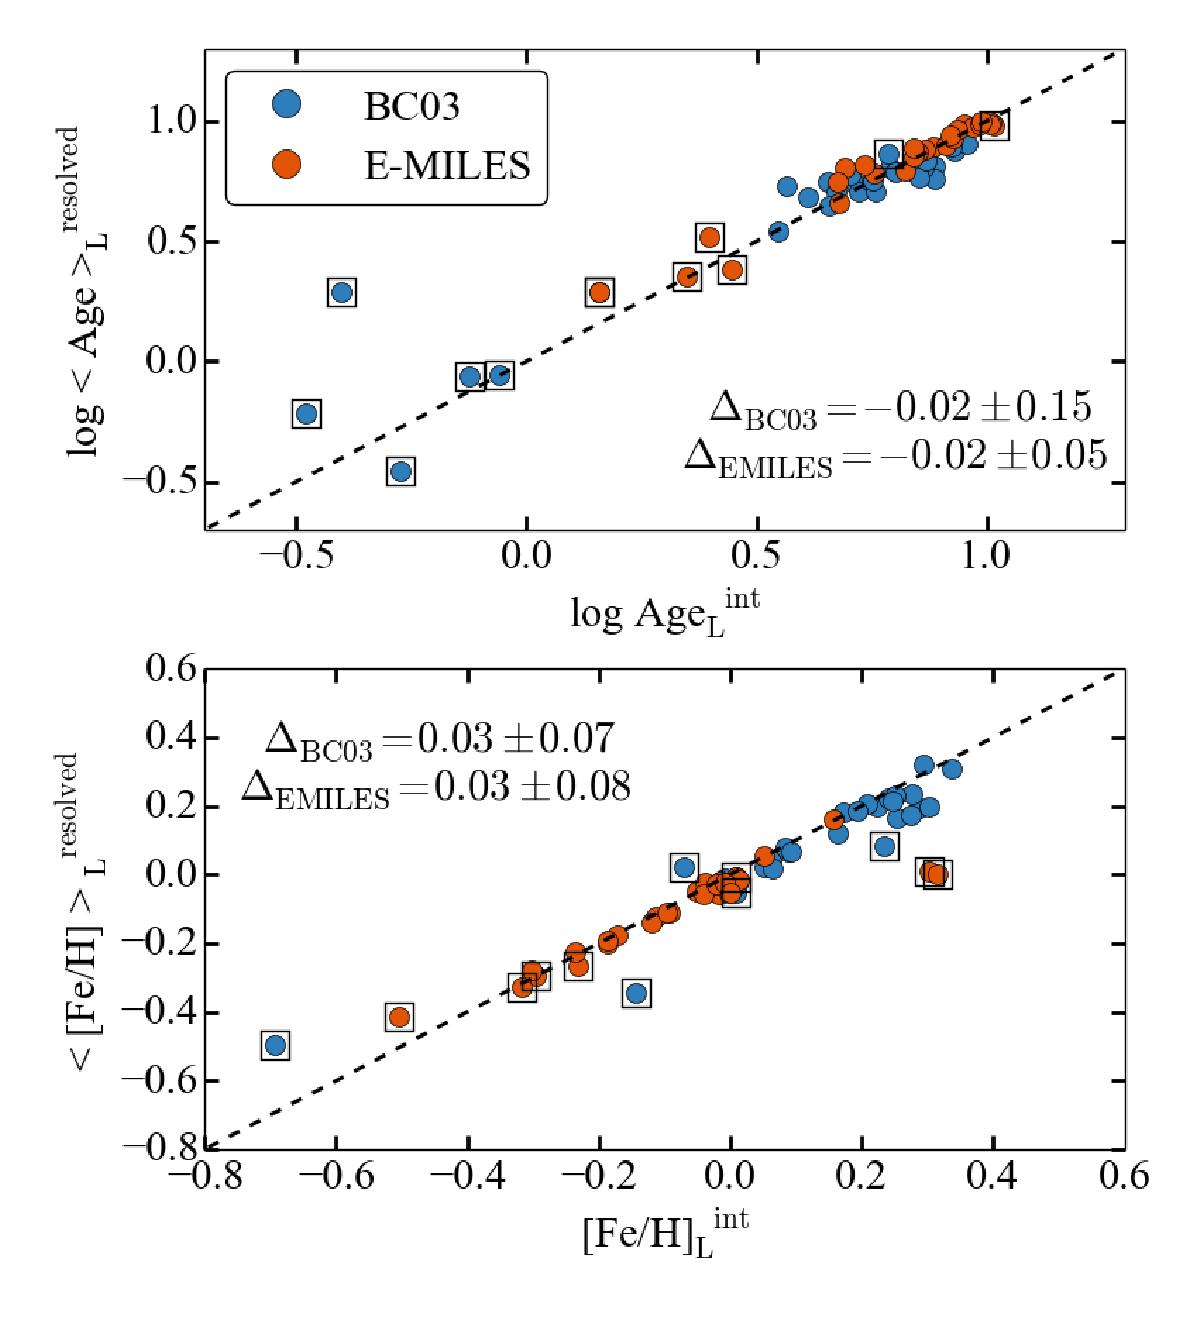
Integrated versus spatially resolved ages and metallicities derived from MUFFIT for the 29 massive early-type galaxies analyzed in this paper. Both BC03 and E-MILES SSP models were used. Symbols enclosed in squares indicate the six peculiar cases analyzed in Sect. 5.1. A normal distribution has been fit to the difference between the x-axis and the y-axis. The mean and standard dispersion is labeled as Δ in each panel. The black dashed line shows the one-to-one relation.
Current usage metrics show cumulative count of Article Views (full-text article views including HTML views, PDF and ePub downloads, according to the available data) and Abstracts Views on Vision4Press platform.
Data correspond to usage on the plateform after 2015. The current usage metrics is available 48-96 hours after online publication and is updated daily on week days.
Initial download of the metrics may take a while.