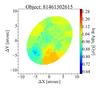
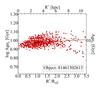
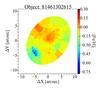
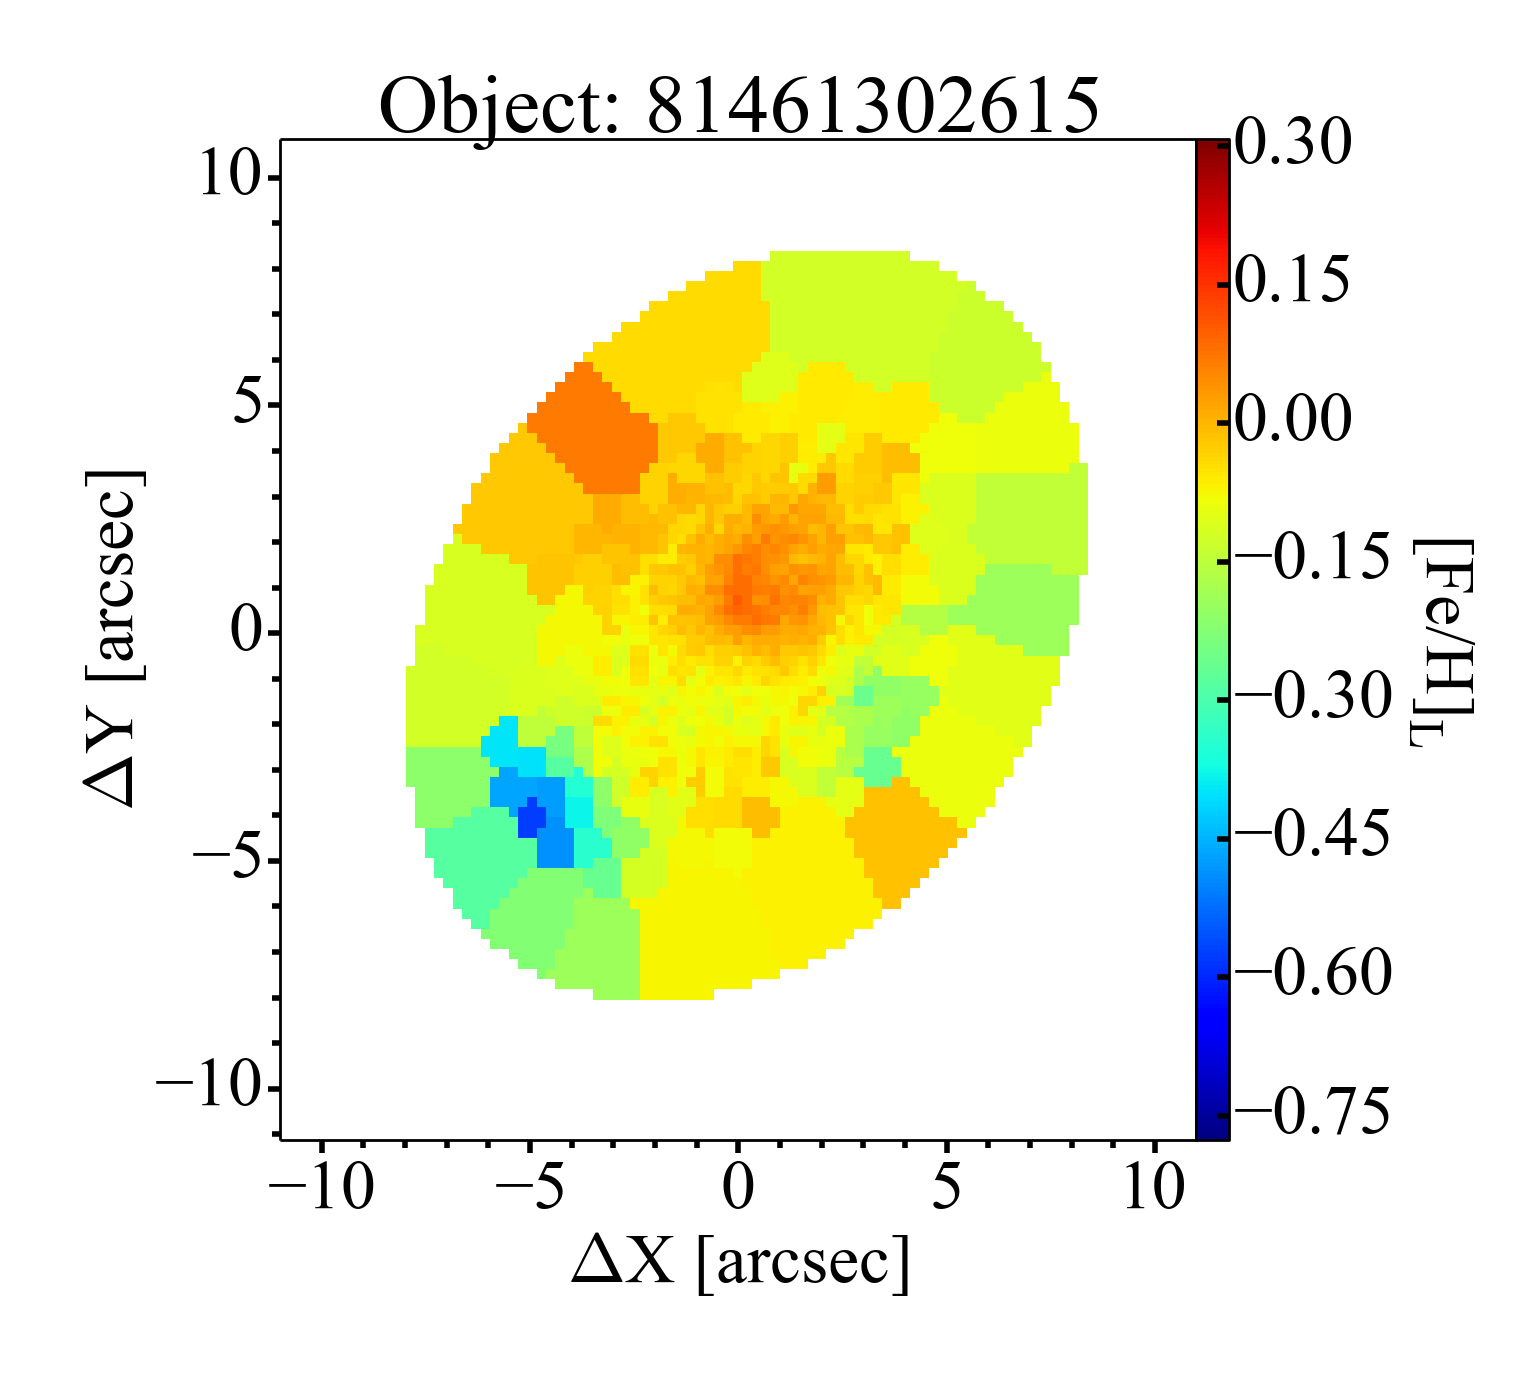
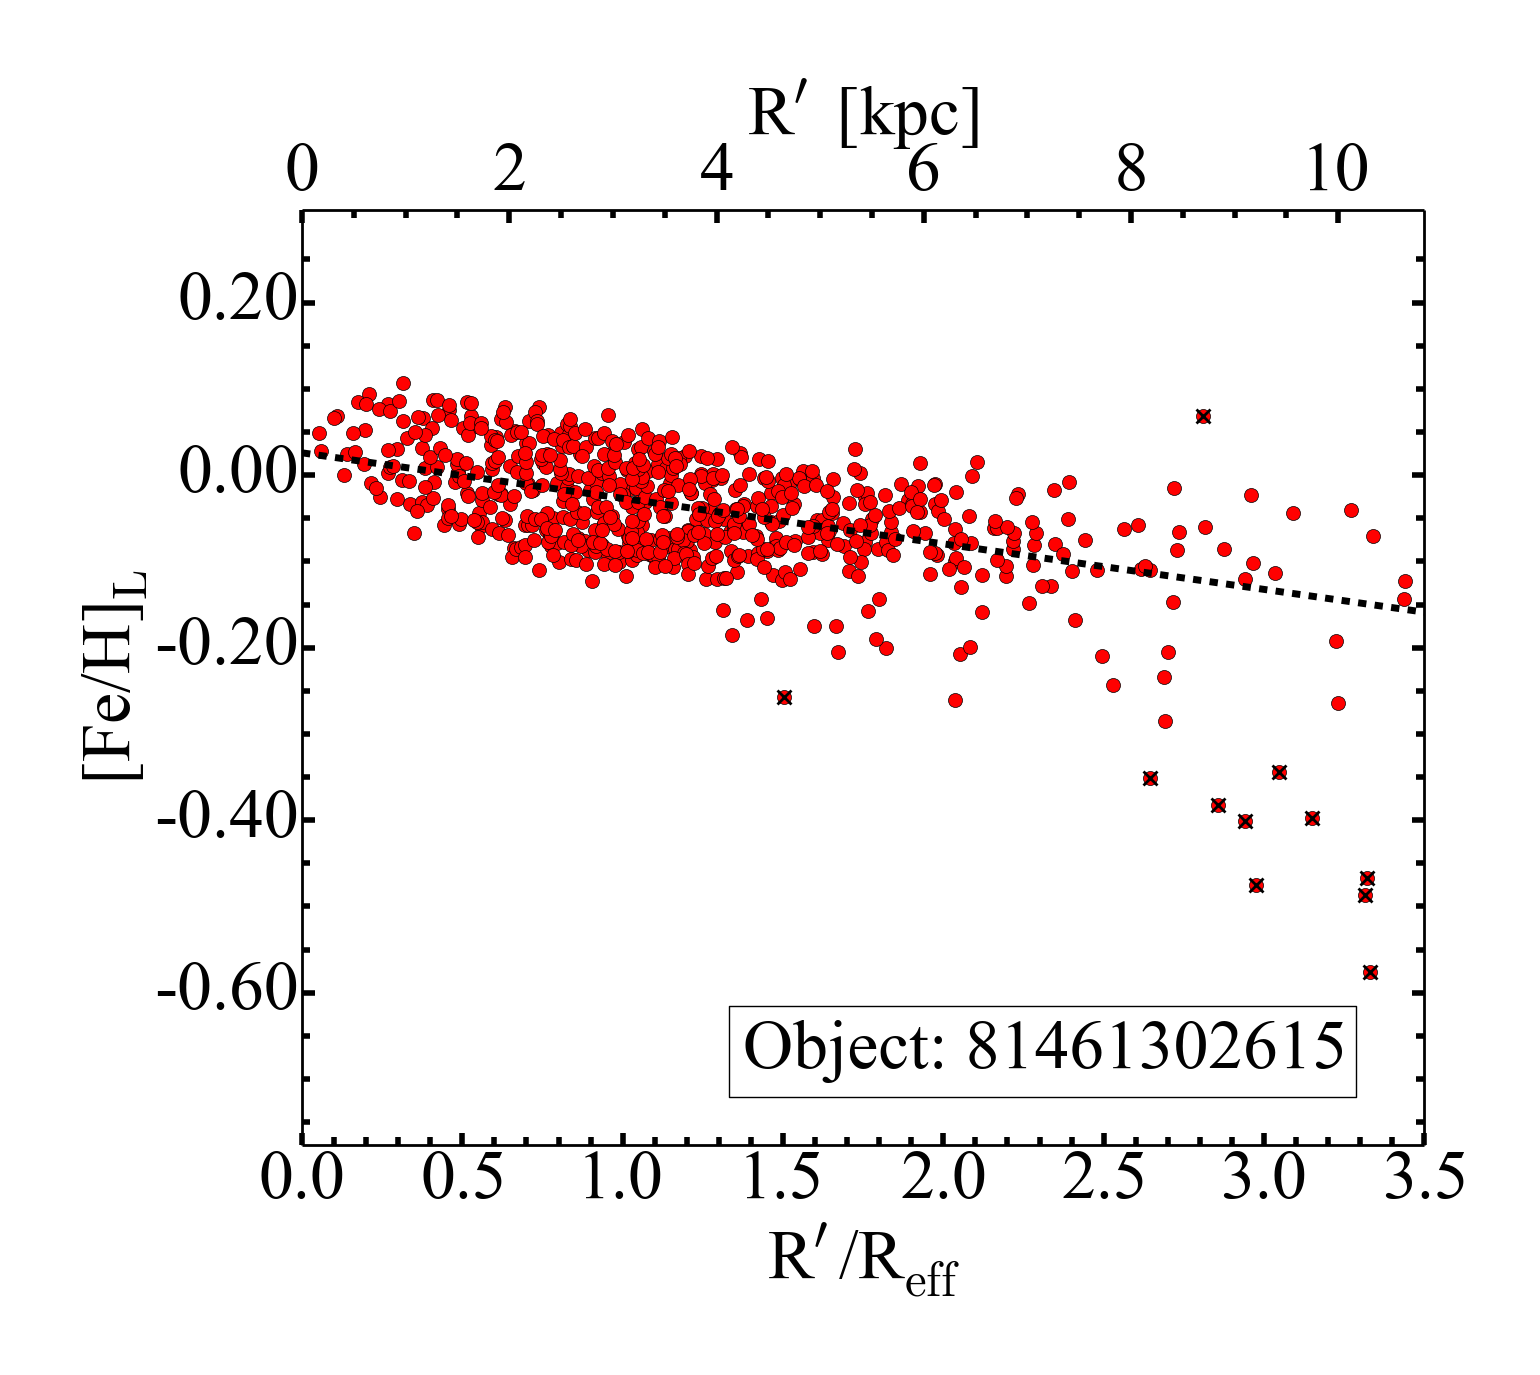
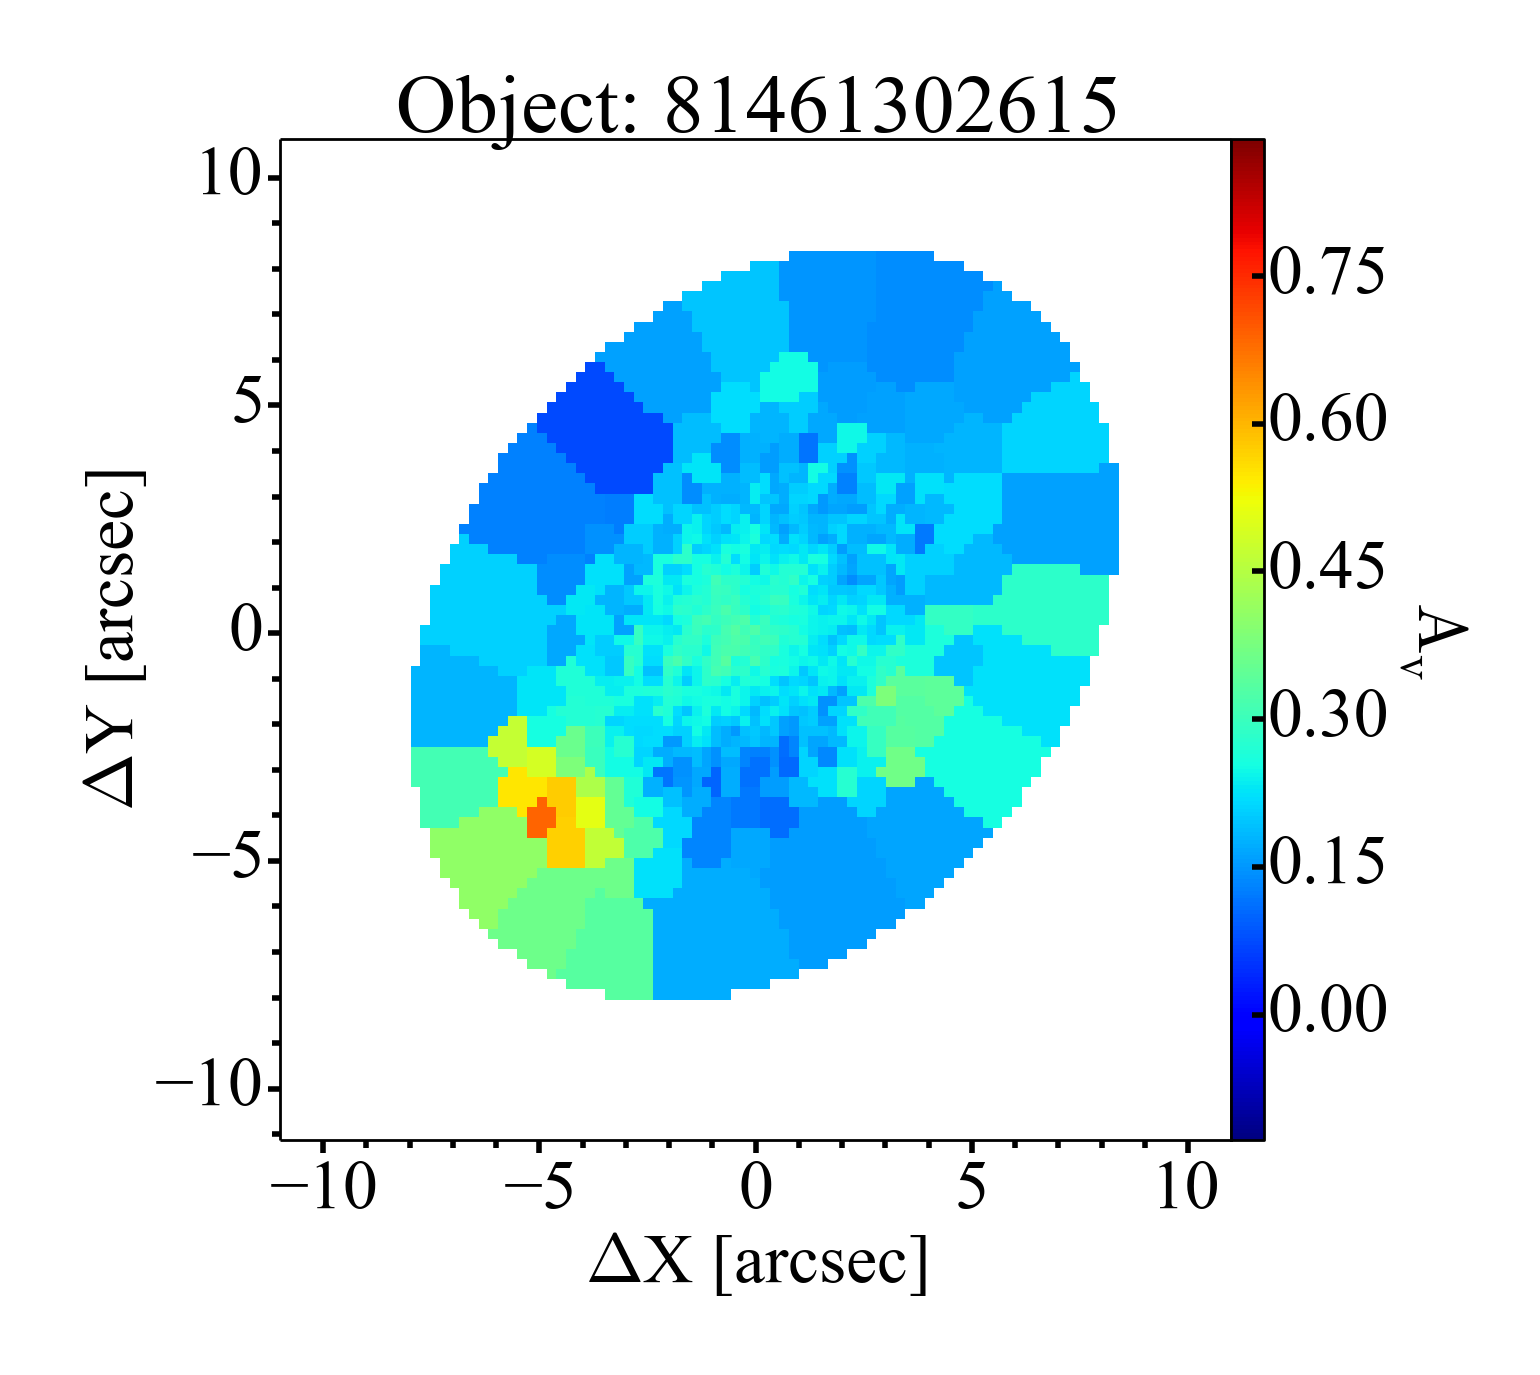
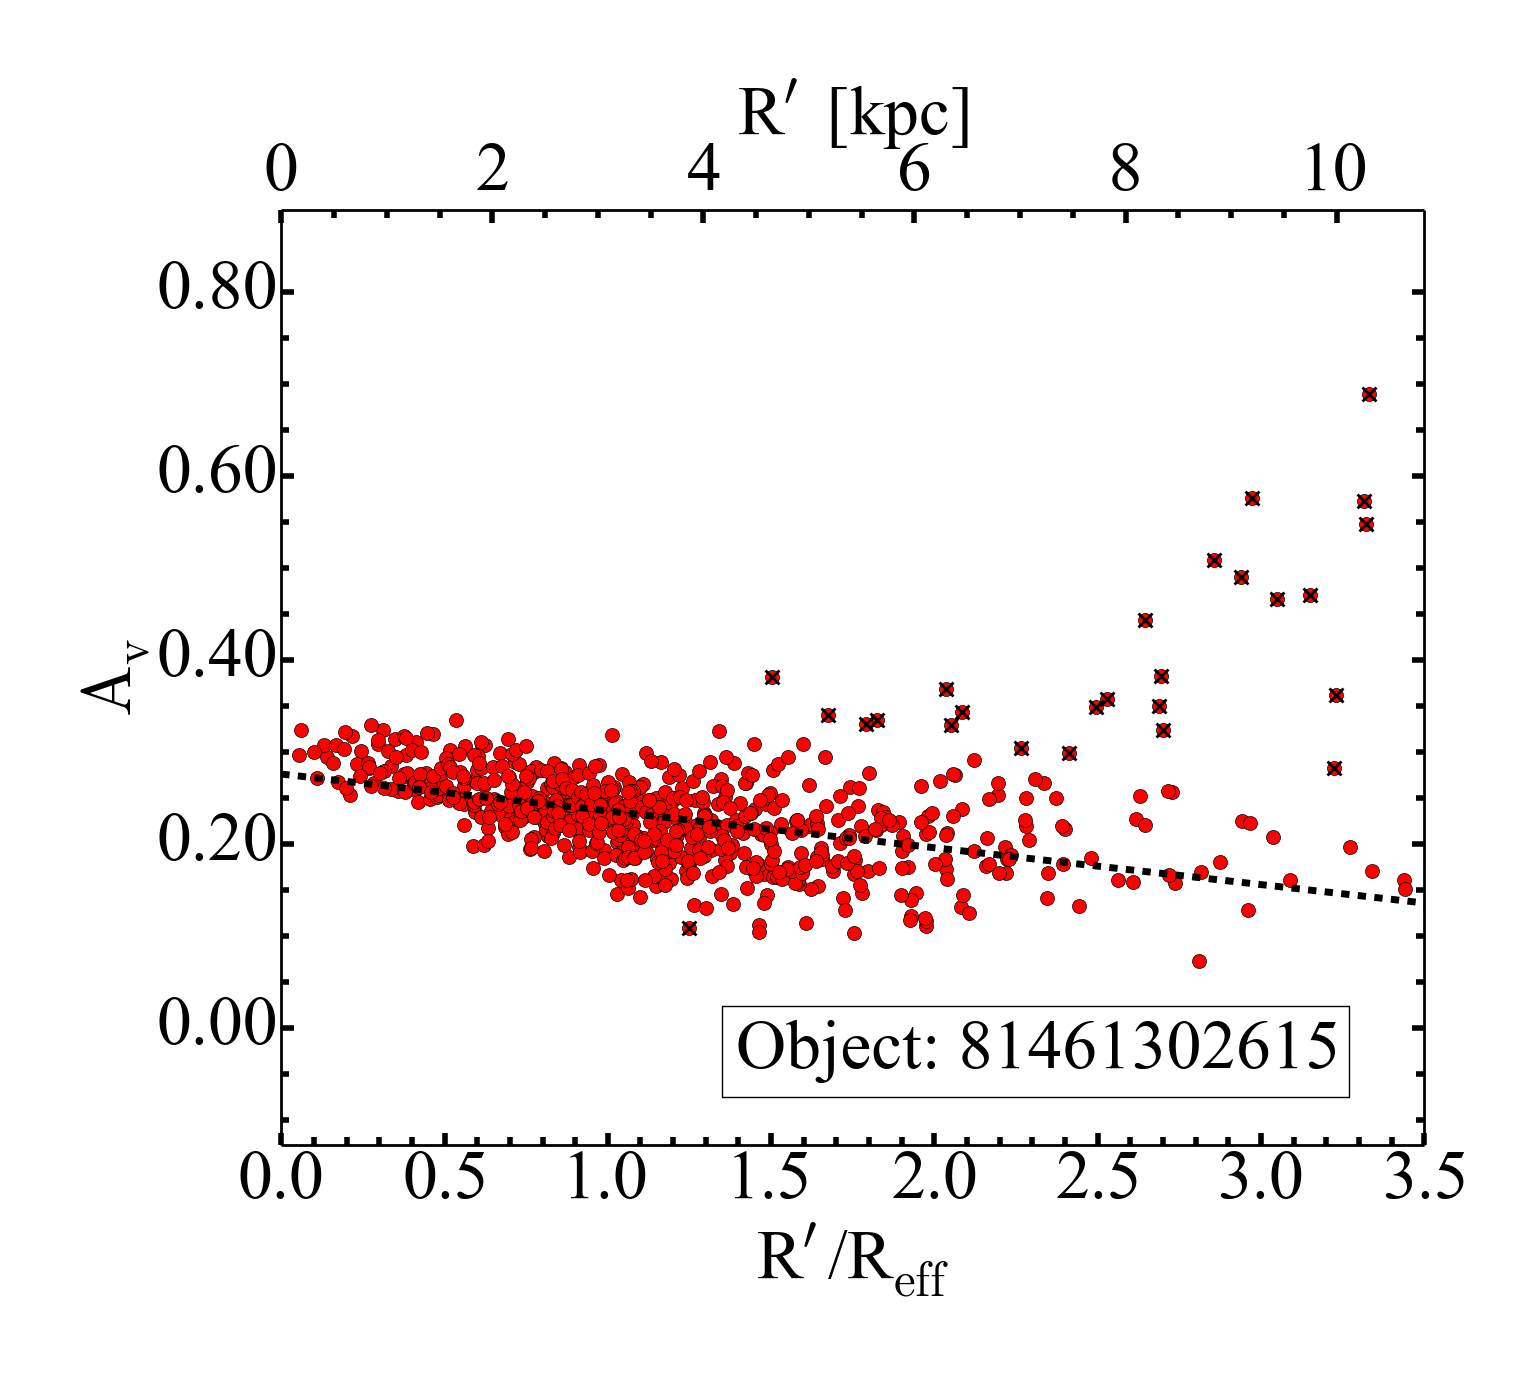
Fig. 3
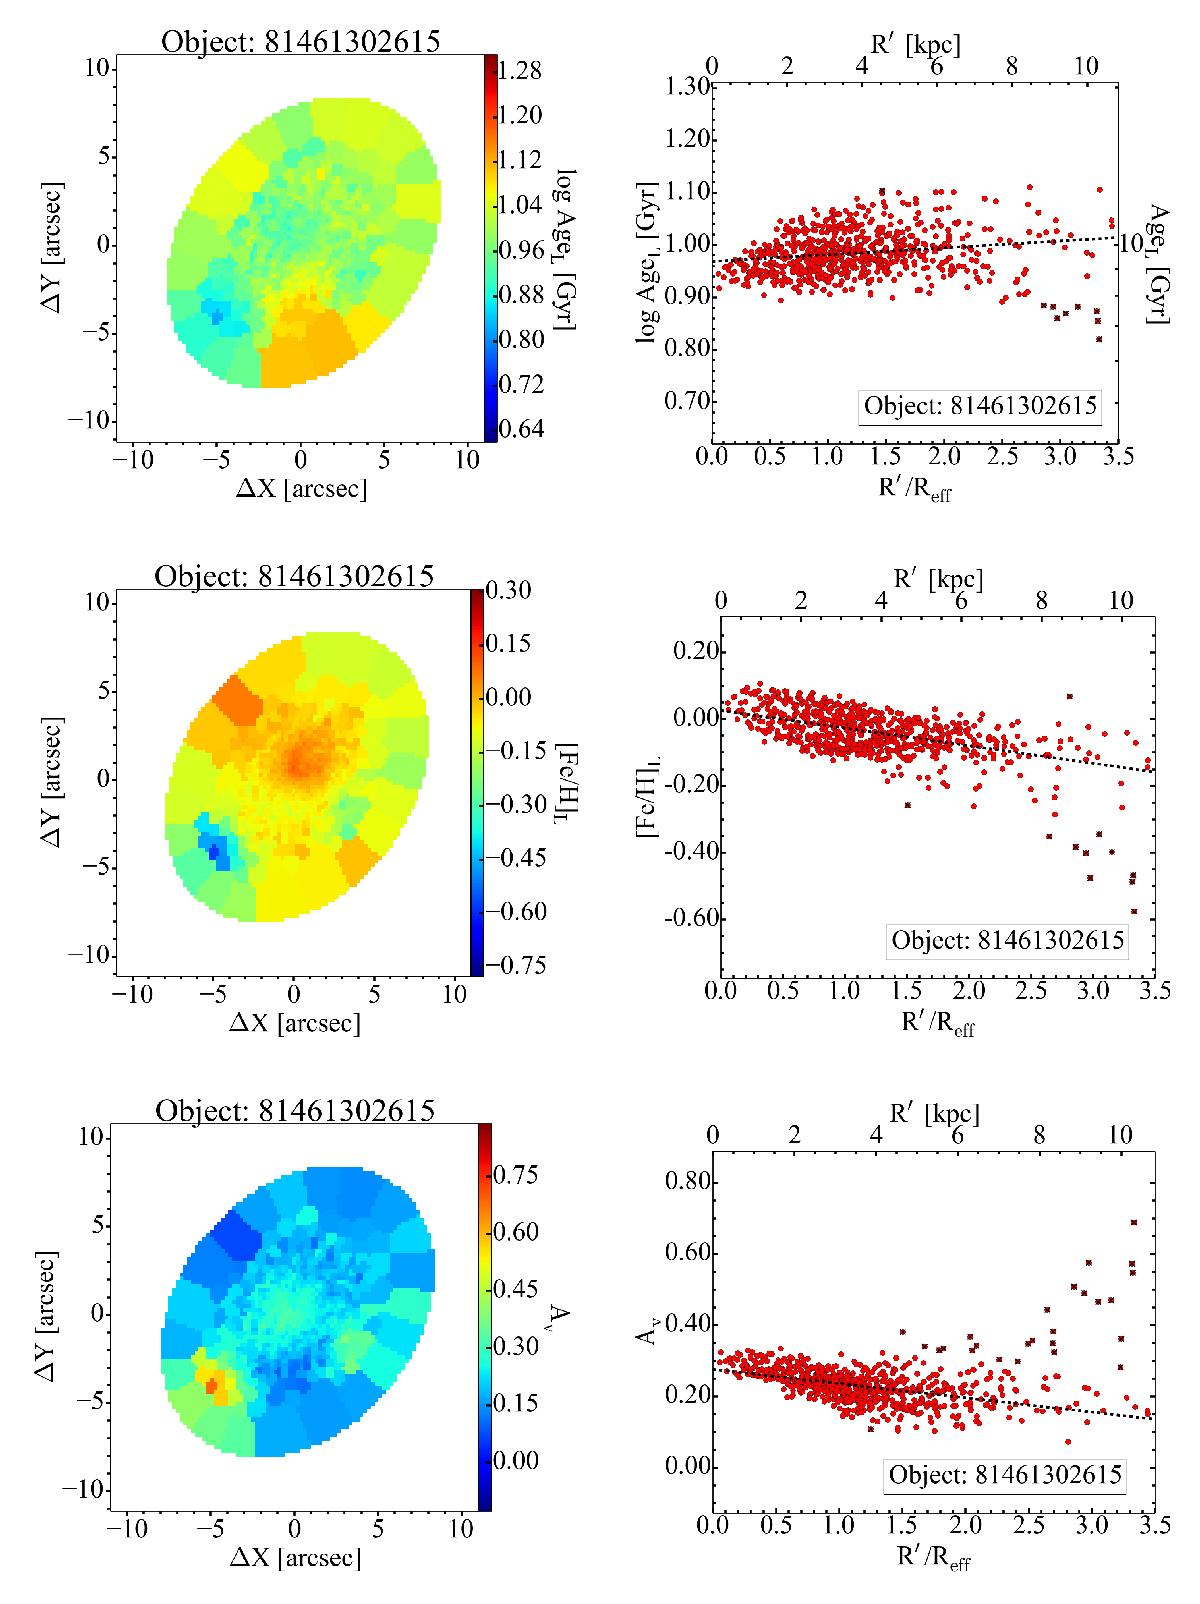
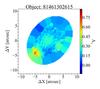
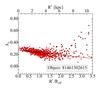
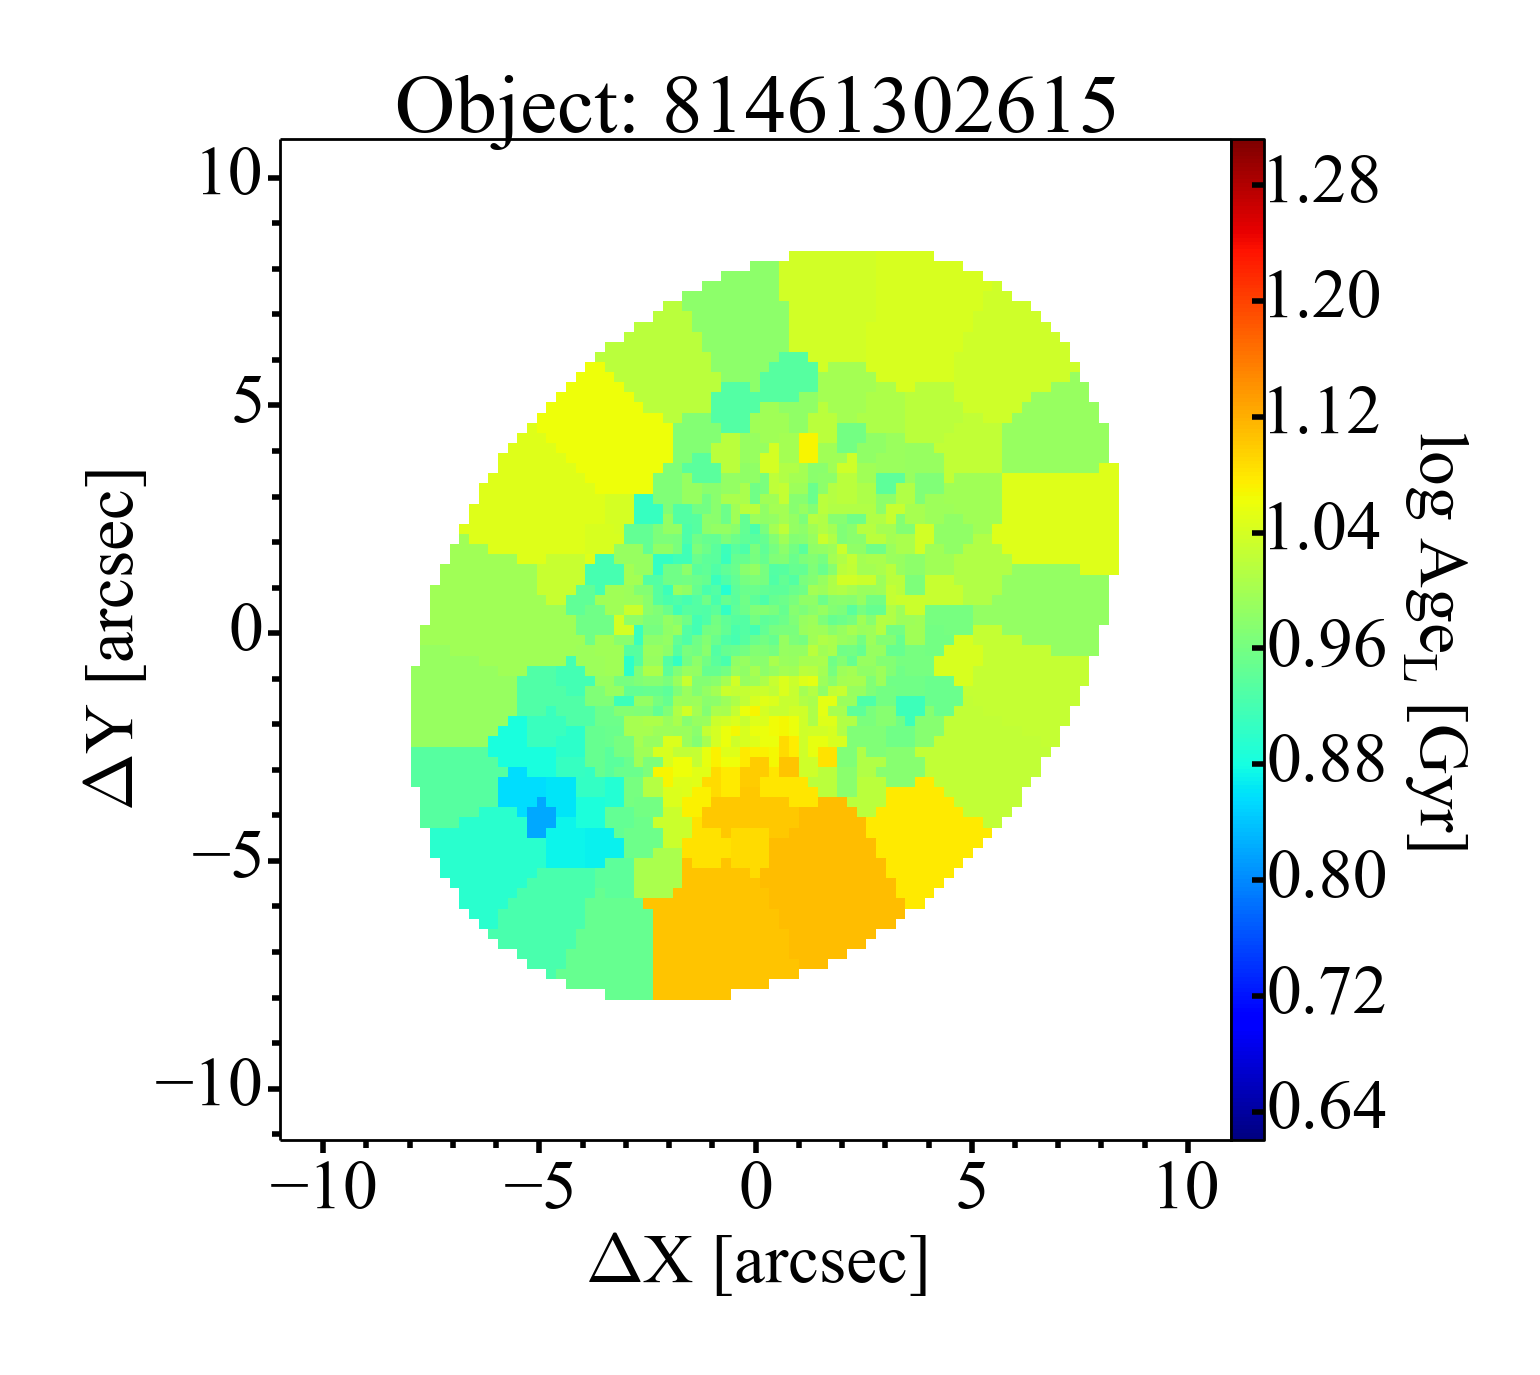
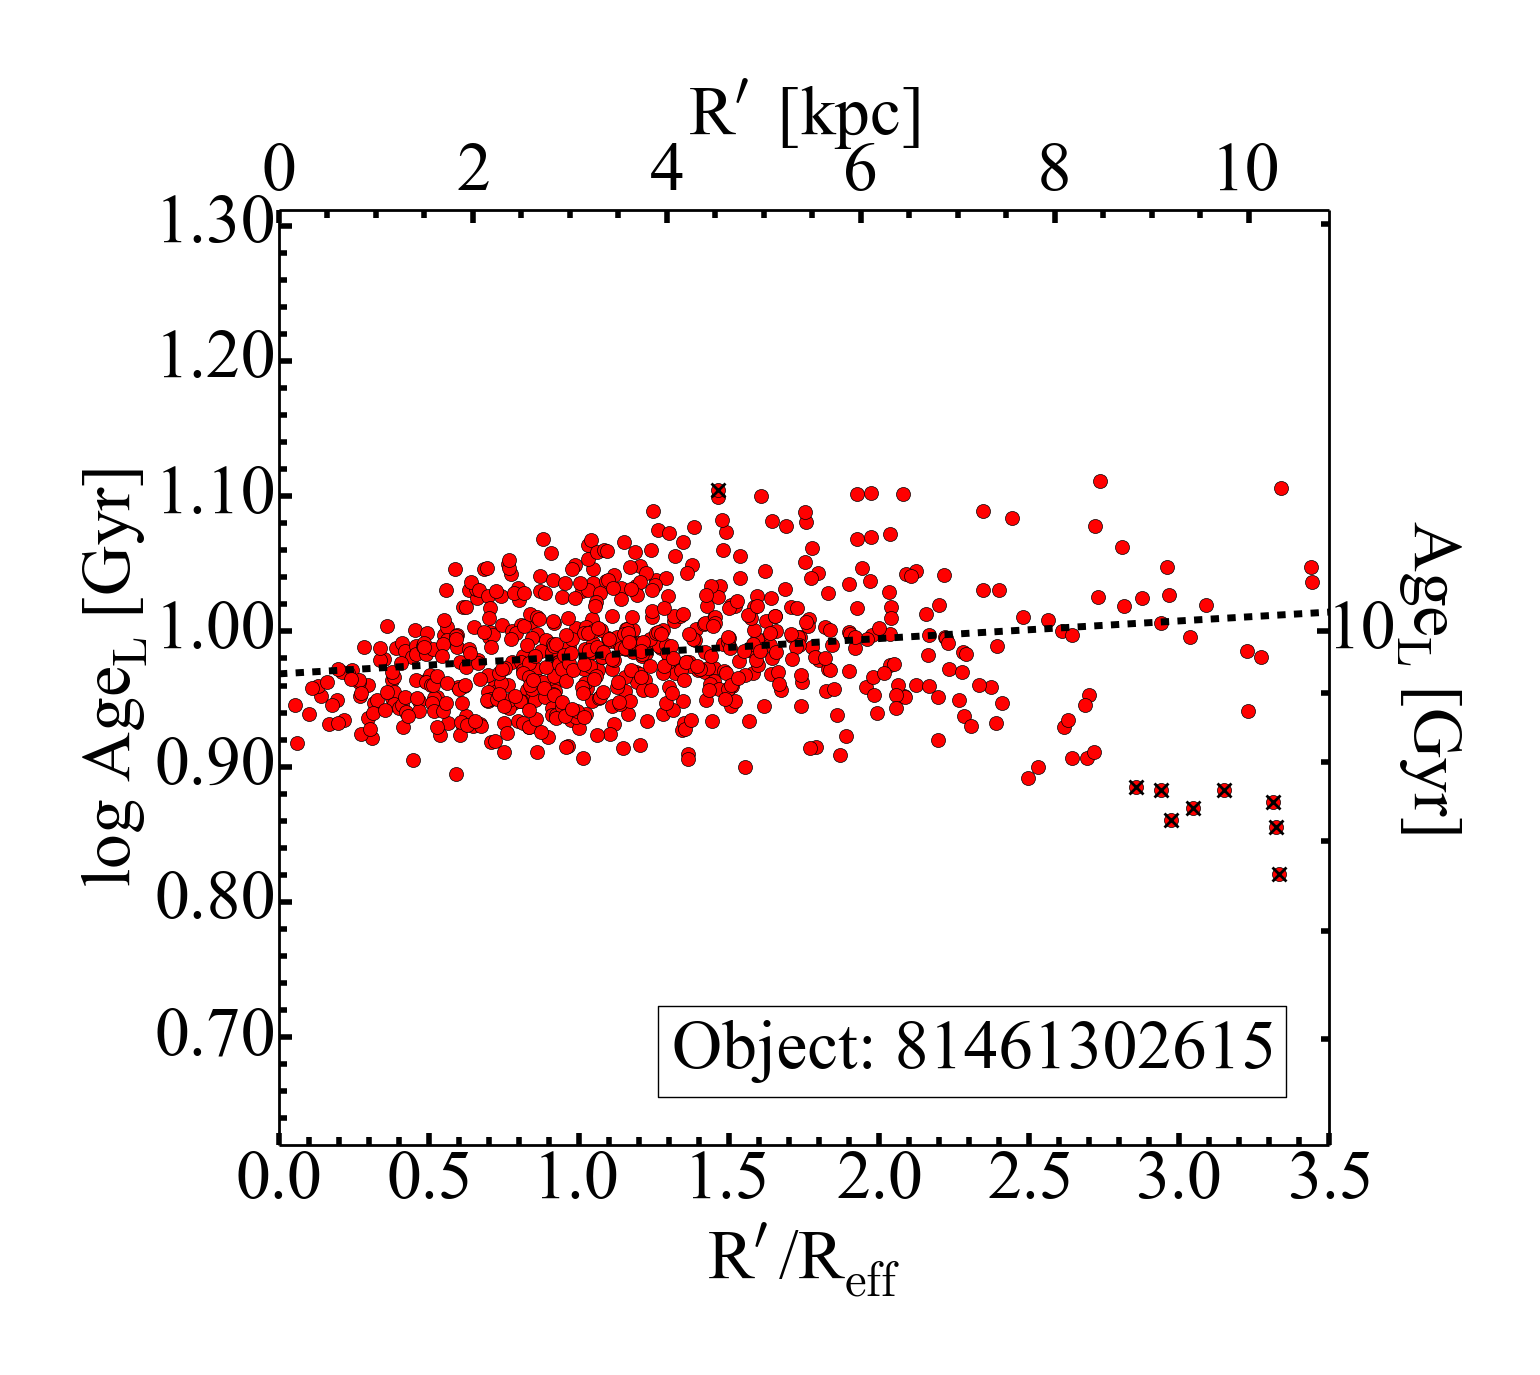
Luminosity-weighted stellar population properties maps and radial profiles analyzed using E-MILES-based models for the example object 81461302615. Left column: 2D maps for log Age, [Fe/H], and Av covering an area of 22′′ × 22′′ around the target galaxy. The color range has been chosen to highlight inhomogeneities. Right column: log Age, [Fe/H], and Av as a function of the circularized galactocentric distance R′ (see Sect. 5). Each red circle corresponds to a bin in the 2D map. The black dashed line corresponds to the error-weighted linear fitting. Black crosses correspond to outliers identified during the sigma-clipping process and were not considered during the fit.

Current usage metrics show cumulative count of Article Views (full-text article views including HTML views, PDF and ePub downloads, according to the available data) and Abstracts Views on Vision4Press platform.
Data correspond to usage on the plateform after 2015. The current usage metrics is available 48-96 hours after online publication and is updated daily on week days.
Initial download of the metrics may take a while.