Free Access
Fig. 2
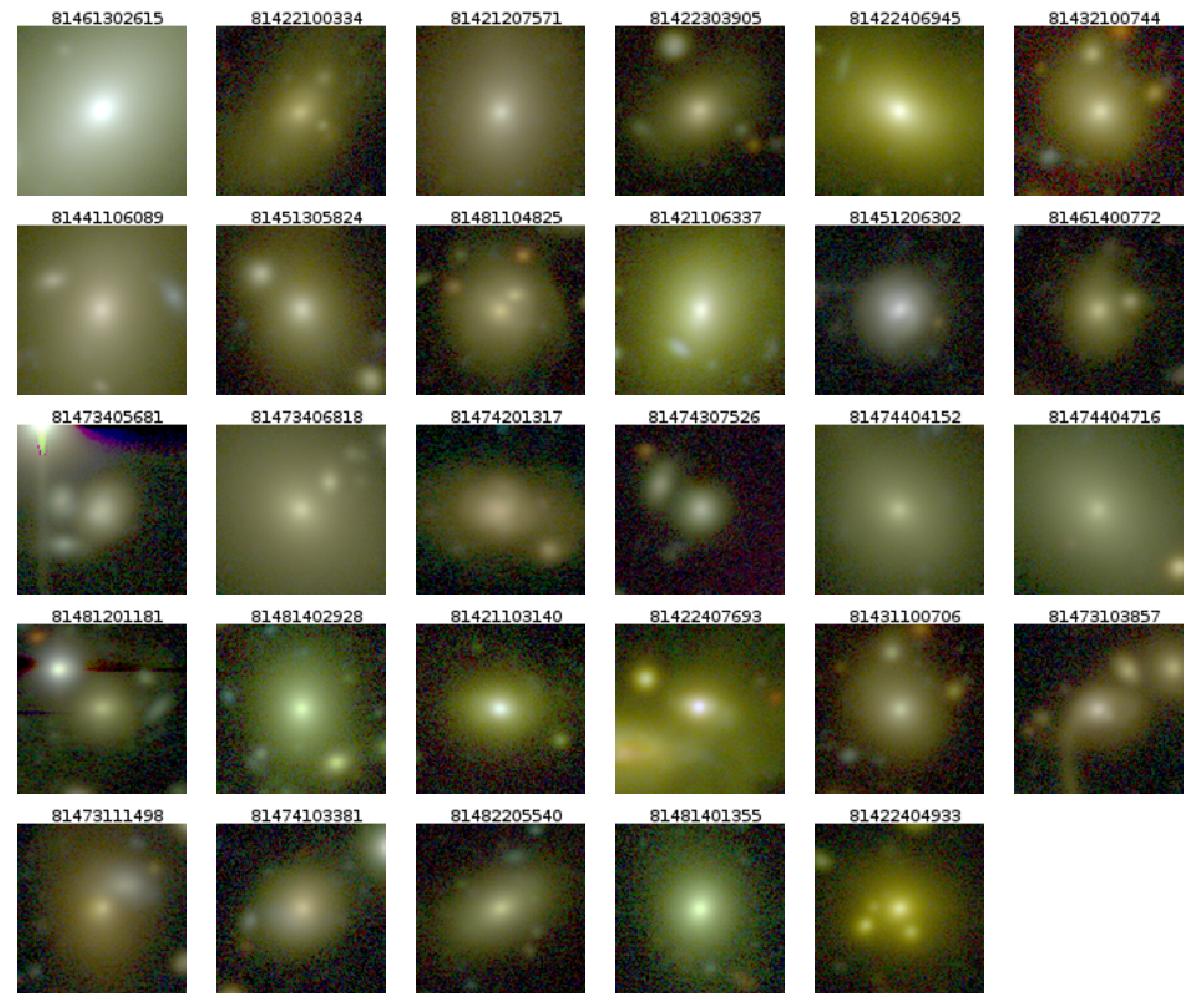
Color images of the 29 massive early-type galaxies analyzed in this paper. Each image corresponds to 22′′ × 22′′ centered on each target. The number of each image corresponds to the ID from Table A.1.
Current usage metrics show cumulative count of Article Views (full-text article views including HTML views, PDF and ePub downloads, according to the available data) and Abstracts Views on Vision4Press platform.
Data correspond to usage on the plateform after 2015. The current usage metrics is available 48-96 hours after online publication and is updated daily on week days.
Initial download of the metrics may take a while.