Fig. 14
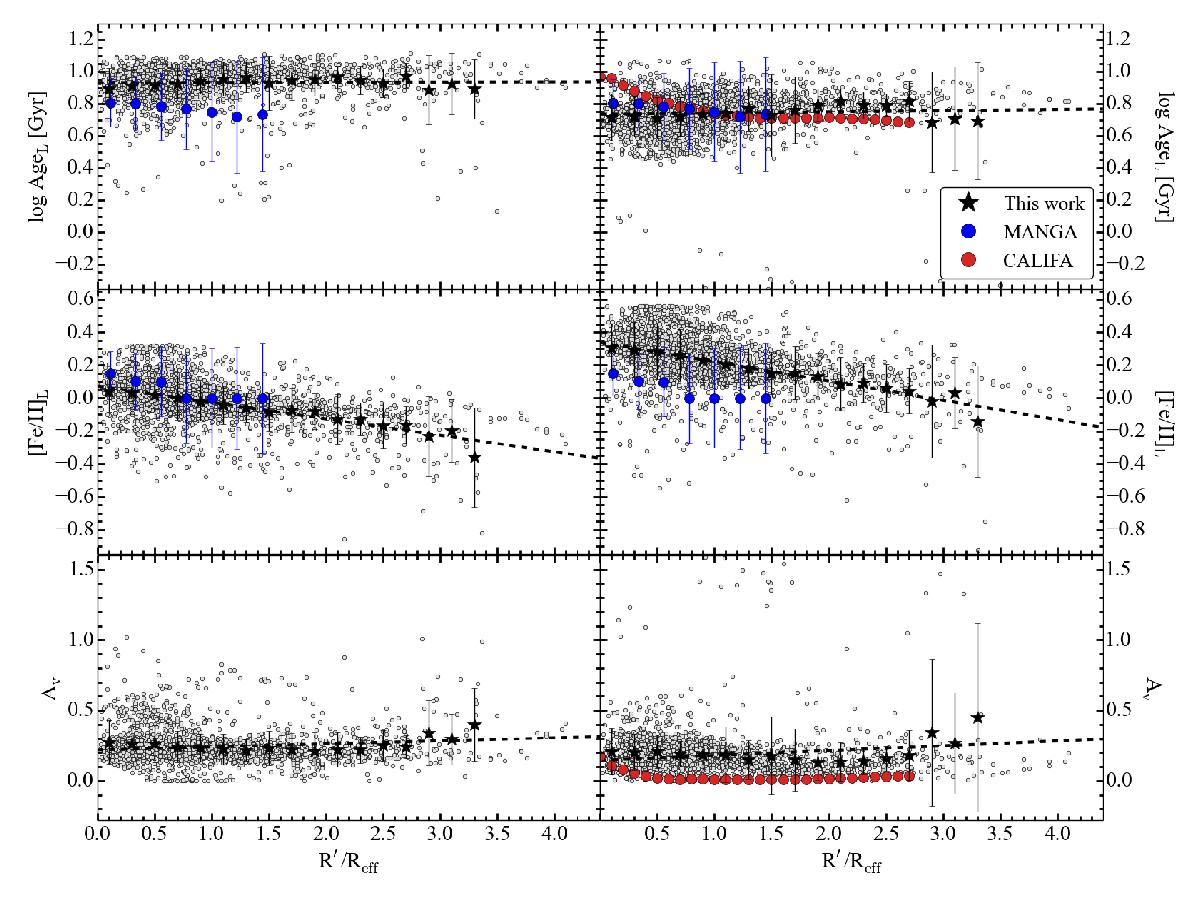
Stacked radial profiles of log AgeL, [Fe/H]L, and Av. The left panels present the case of the E-MILES SSP models, and the right panels show the case of BC03. Gray open symbols correspond to the stellar population values of each individual bin in each spatially resolved object. Stars have been obtained by averaging the stellar population values of the sample in constant bins of 0.2 Reff between 0 ≤ R ≤ 3.6 Reff. The error bars are the standard deviation of the mean. When available, the profiles obtained by CALIFA (González Delgado et al. 2015) have been overplotted. MaNGA (Goddard et al. 2017) for early-type galaxies with log M⋆> 11.0 was also considered. The dashed black line corresponds to the best linear fit of the average stellar population values (stars).
Current usage metrics show cumulative count of Article Views (full-text article views including HTML views, PDF and ePub downloads, according to the available data) and Abstracts Views on Vision4Press platform.
Data correspond to usage on the plateform after 2015. The current usage metrics is available 48-96 hours after online publication and is updated daily on week days.
Initial download of the metrics may take a while.