Fig. 13
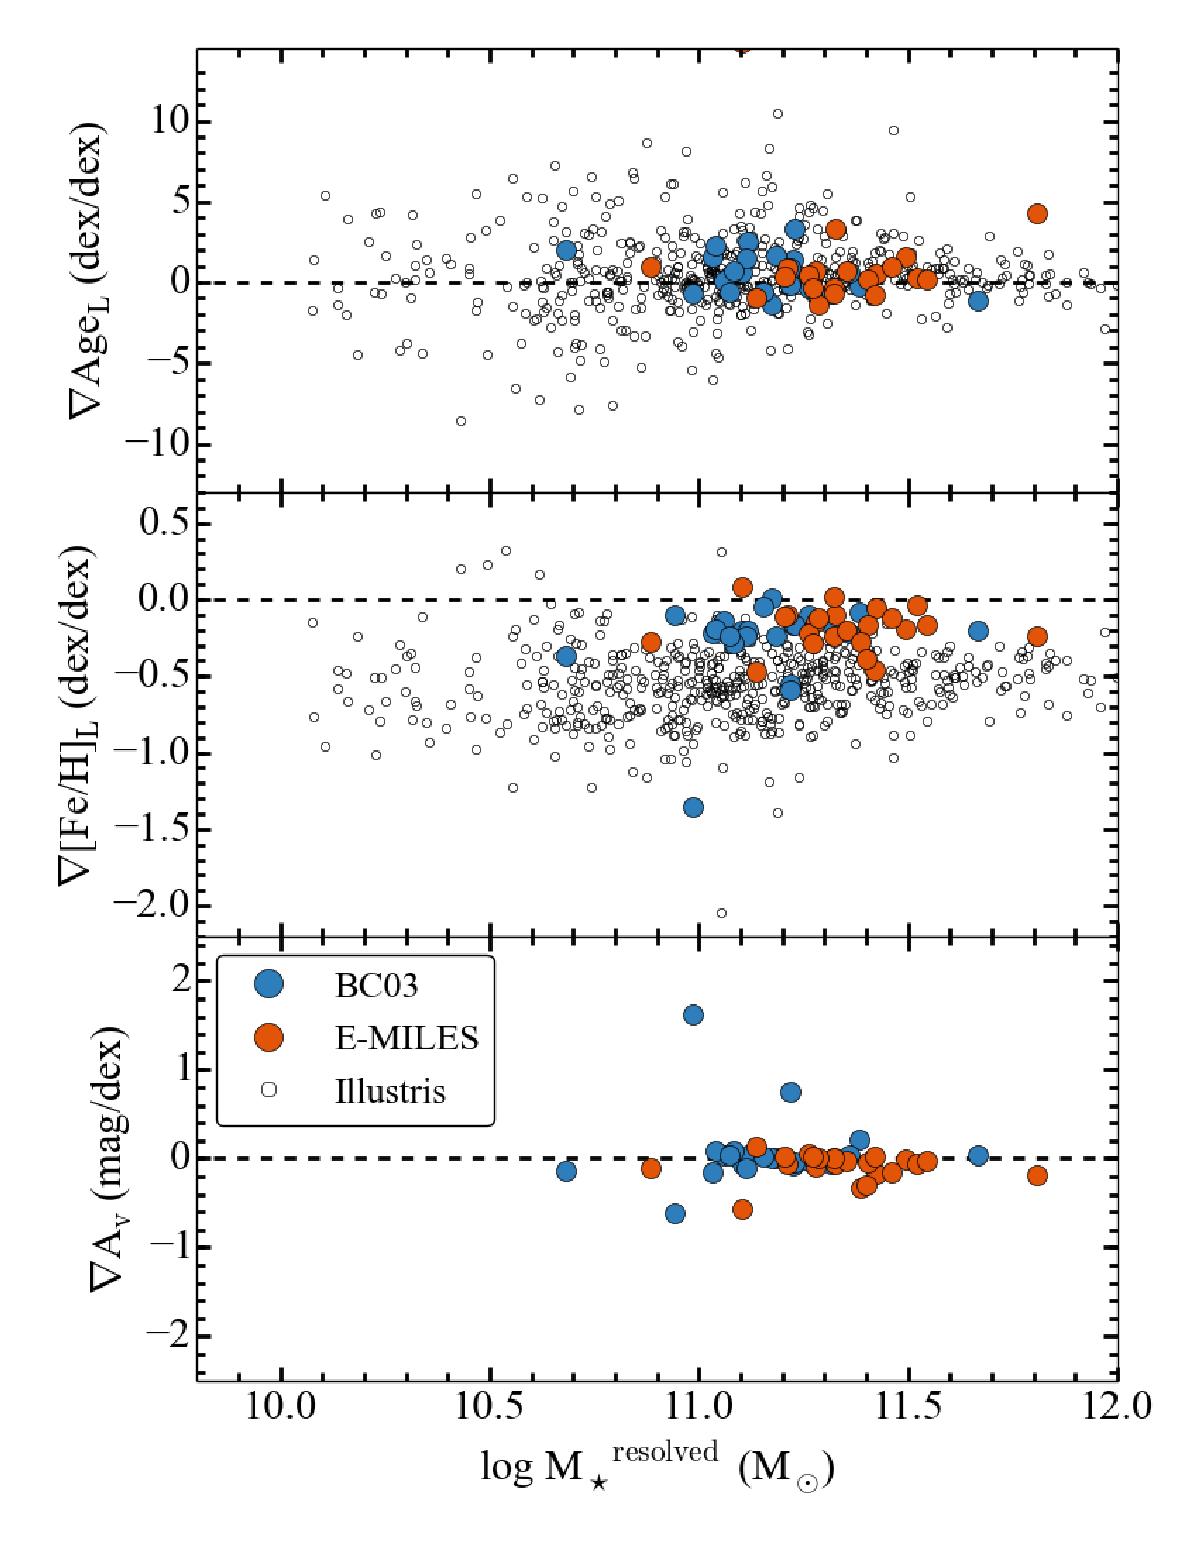
Stellar population gradients AgeL, [Fe/H]L , and Av, in logarithmic space as a function of stellar mass. BC03 and E-MILES, SSP models have been included. Open circles correspond to Illustris simulation measurements in the outer (1–2 Reff) galaxy region (Cook et al. 2016). Dashed black lines show flat gradients. The six objects with peculiar profiles (Sect. 5.1) have been removed from the analysis.
Current usage metrics show cumulative count of Article Views (full-text article views including HTML views, PDF and ePub downloads, according to the available data) and Abstracts Views on Vision4Press platform.
Data correspond to usage on the plateform after 2015. The current usage metrics is available 48-96 hours after online publication and is updated daily on week days.
Initial download of the metrics may take a while.