Free Access
Fig. 12
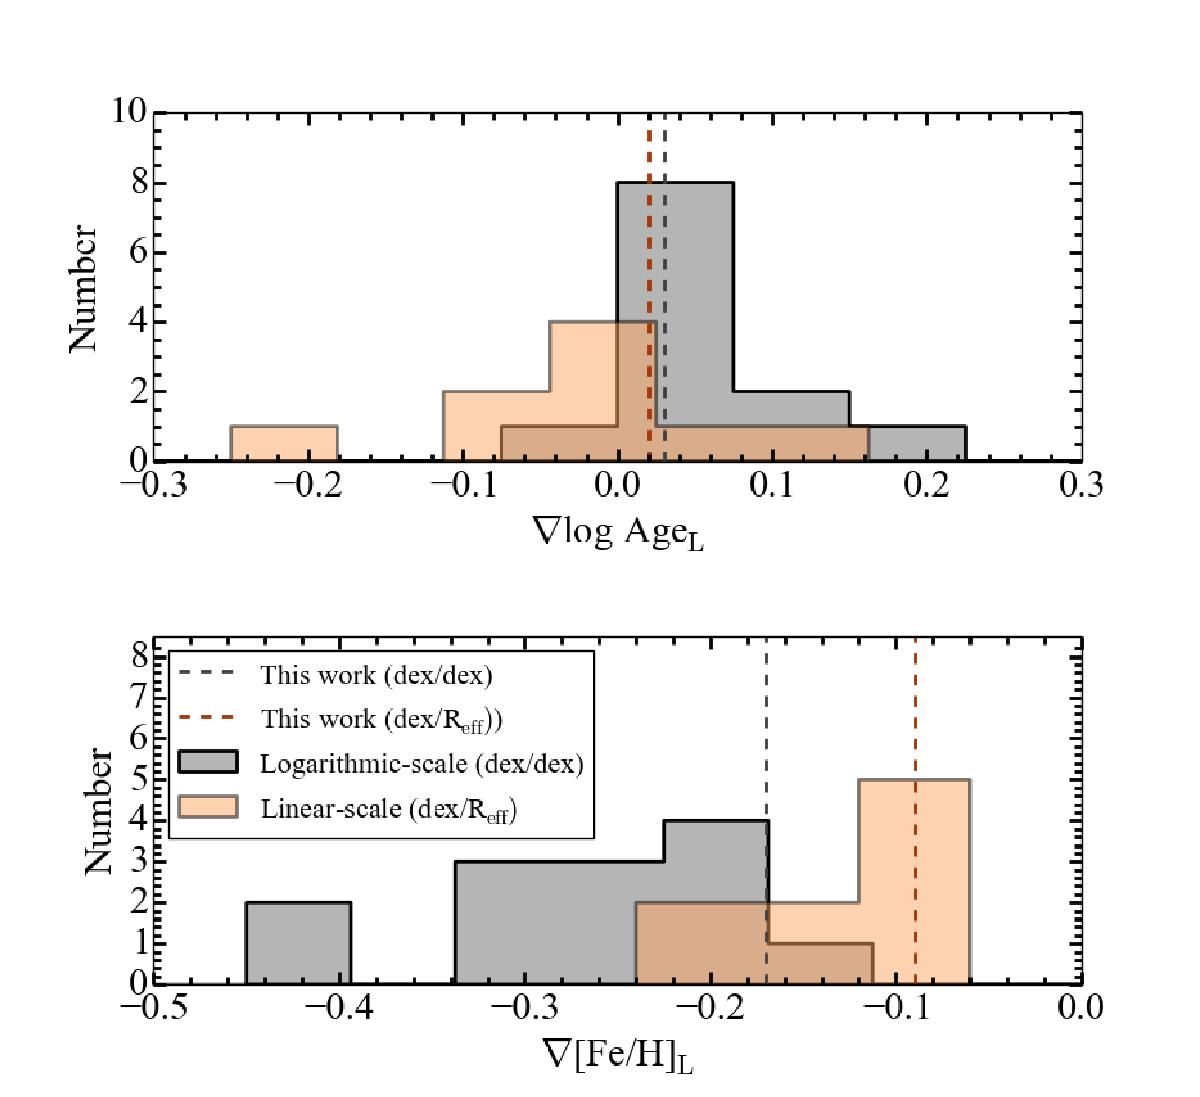
Distribution of age and metallicity gradients for early-type galaxies obtained in previous studies. All values have been taken from Table 3. The dashed lines represent the stellar population gradients obtained in this work.
Current usage metrics show cumulative count of Article Views (full-text article views including HTML views, PDF and ePub downloads, according to the available data) and Abstracts Views on Vision4Press platform.
Data correspond to usage on the plateform after 2015. The current usage metrics is available 48-96 hours after online publication and is updated daily on week days.
Initial download of the metrics may take a while.