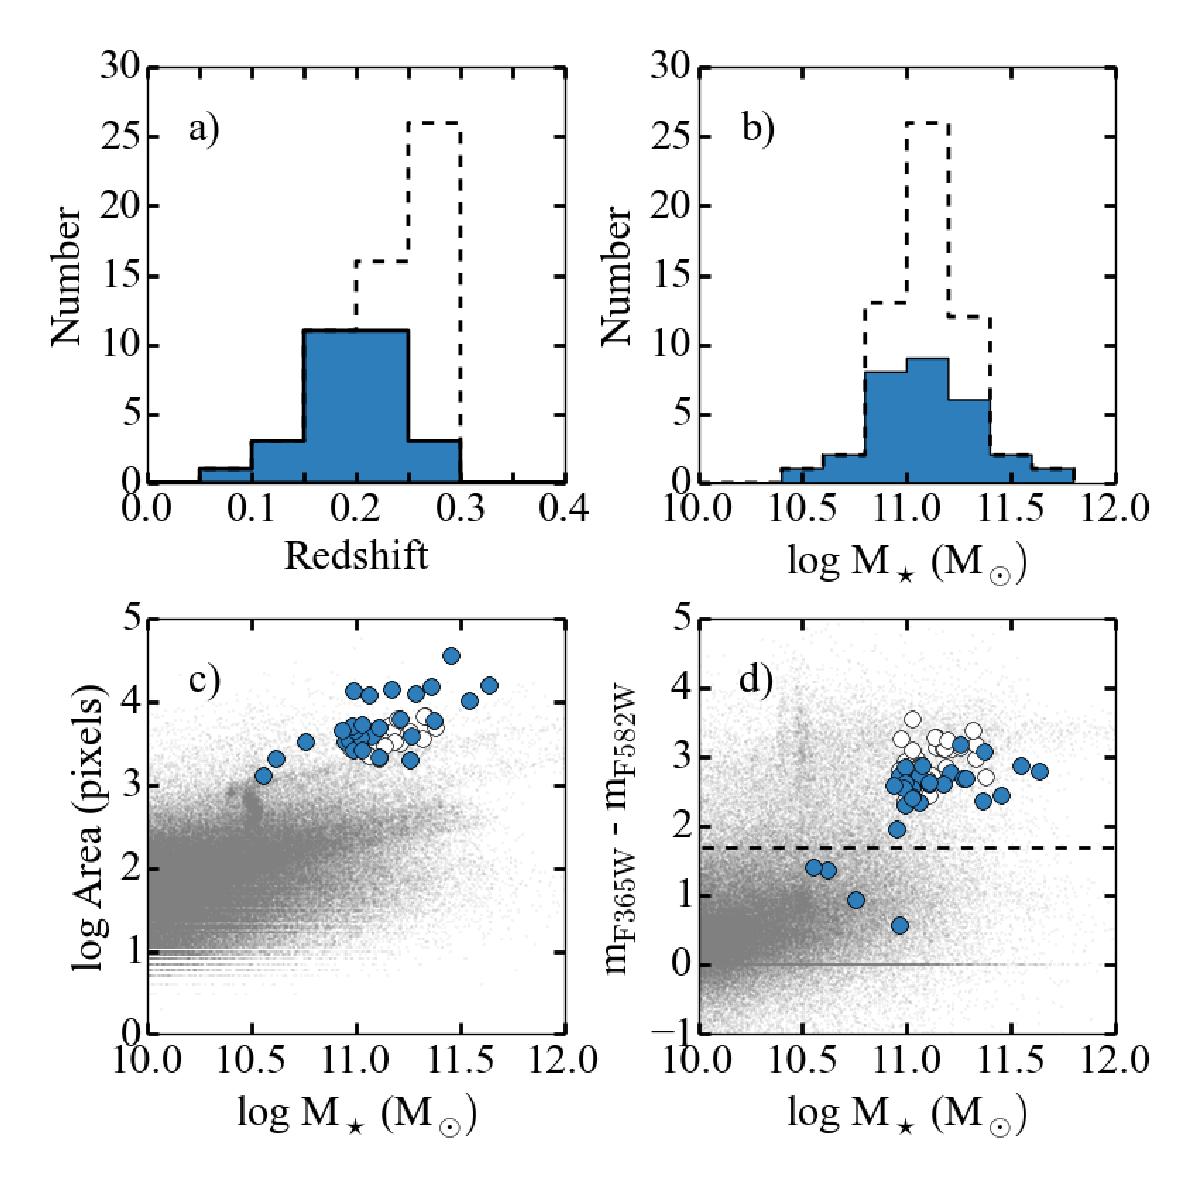
Fig. 1

Properties of the analyzed sample from the ALHAMBRA catalog. a) Best photometric redshift distribution, b) stellar mass distribution, c) mass versus isophotal area relation, and d) color (mF365W−mF582W) versus stellar mass diagram. Gray symbols correspond to the total ALHAMBRA sample. Dashed histograms and open circles correspond to our initial sample, and blue histograms and symbols correspond to our final sample of 29 early-type galaxies after quality control cuts. The dashed black line represents the arbitrary red sequence-blue cloud division at mF365W−mF582W < 1.7.
Current usage metrics show cumulative count of Article Views (full-text article views including HTML views, PDF and ePub downloads, according to the available data) and Abstracts Views on Vision4Press platform.
Data correspond to usage on the plateform after 2015. The current usage metrics is available 48-96 hours after online publication and is updated daily on week days.
Initial download of the metrics may take a while.


