Fig. 9
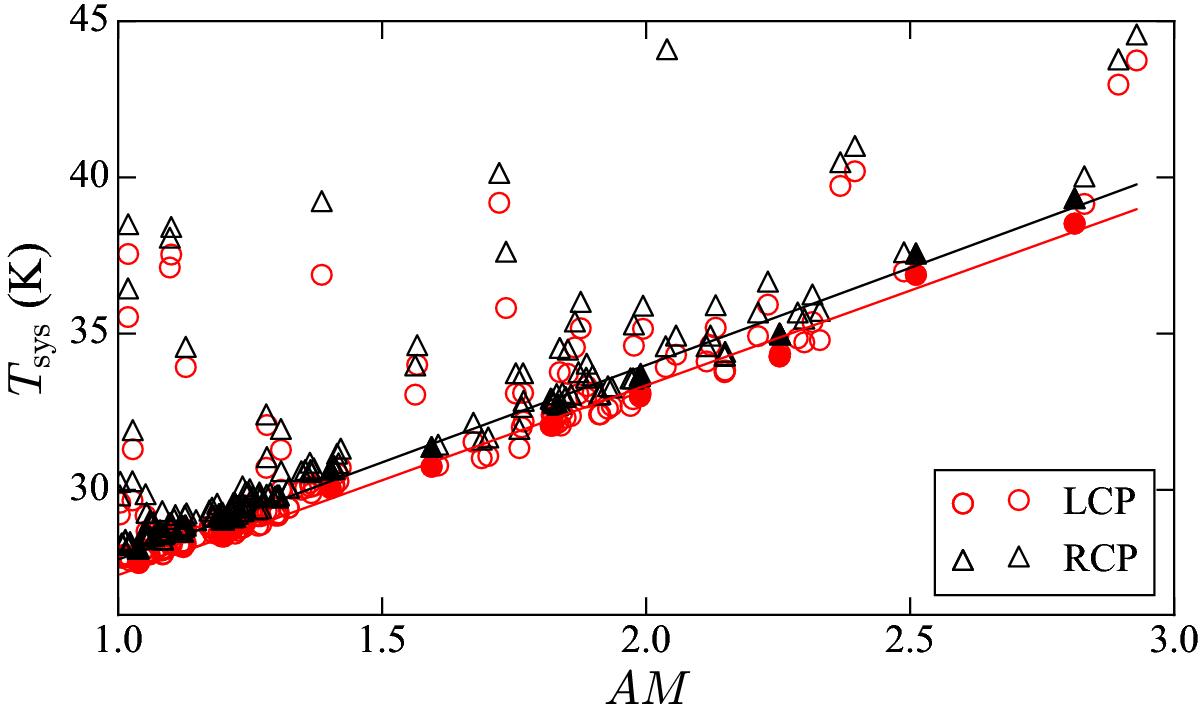
LCP (red circles) and RCP (black triangles) system temperature (Tsys) measurements versus the airmass (AM) for one observing session at 4.85 GHz. The AM range is split into a given number of bins and the data points with the lowest Tsys within each bin (filled markers) are used to fit the two lower envelopes (solid lines). Their slopes are practically identical, indicating that the atmospheric absorption does not influence the polarization of the transmitted radiation.
Current usage metrics show cumulative count of Article Views (full-text article views including HTML views, PDF and ePub downloads, according to the available data) and Abstracts Views on Vision4Press platform.
Data correspond to usage on the plateform after 2015. The current usage metrics is available 48-96 hours after online publication and is updated daily on week days.
Initial download of the metrics may take a while.