Fig. 7
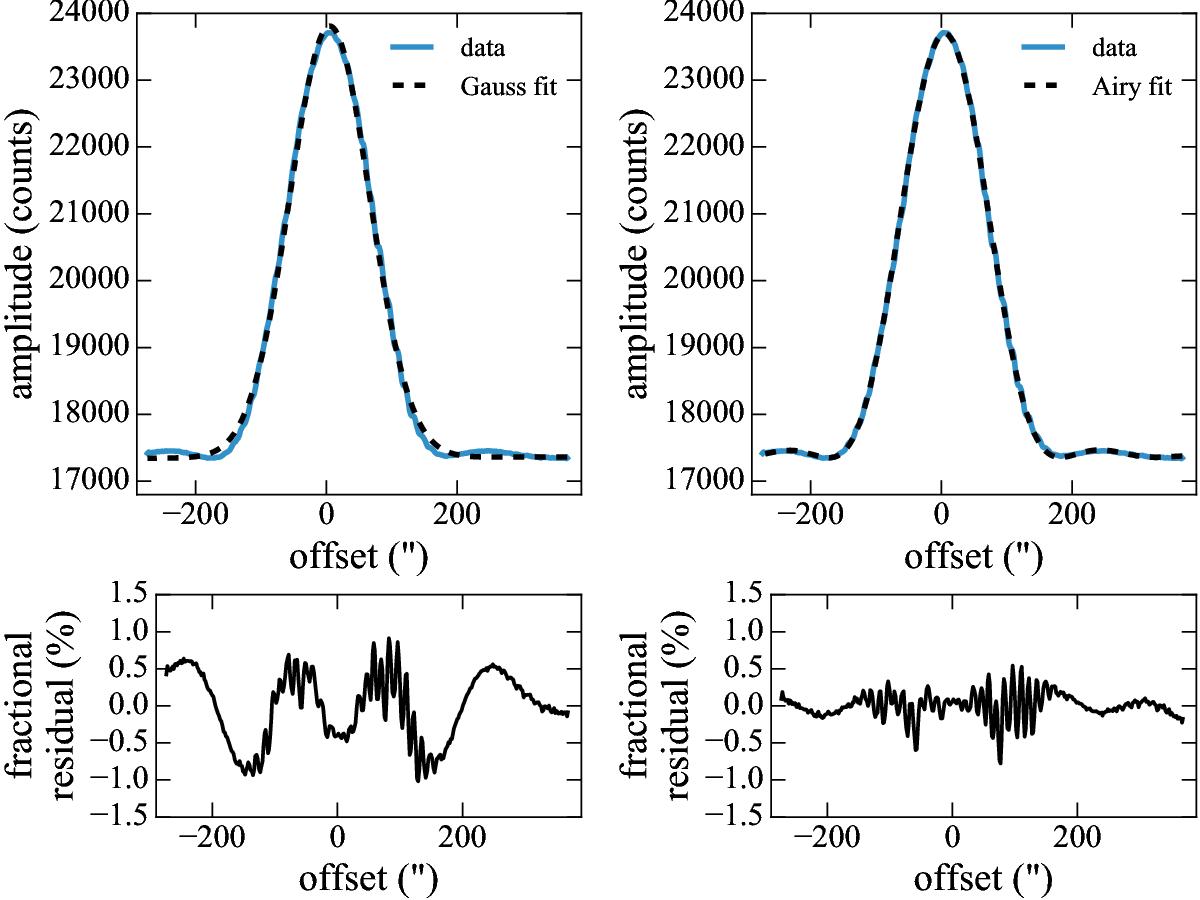
Comparison between the Gaussian (left column) and Airy disk (right column) beam pattern models. The recorded data sets are shown in the top row with dark blue lines and the model fits with dashed, black lines. The corresponding fractional residuals, (data-model)/data, are given in the bottom row for a direct comparison between the models.
Current usage metrics show cumulative count of Article Views (full-text article views including HTML views, PDF and ePub downloads, according to the available data) and Abstracts Views on Vision4Press platform.
Data correspond to usage on the plateform after 2015. The current usage metrics is available 48-96 hours after online publication and is updated daily on week days.
Initial download of the metrics may take a while.