Fig. 6
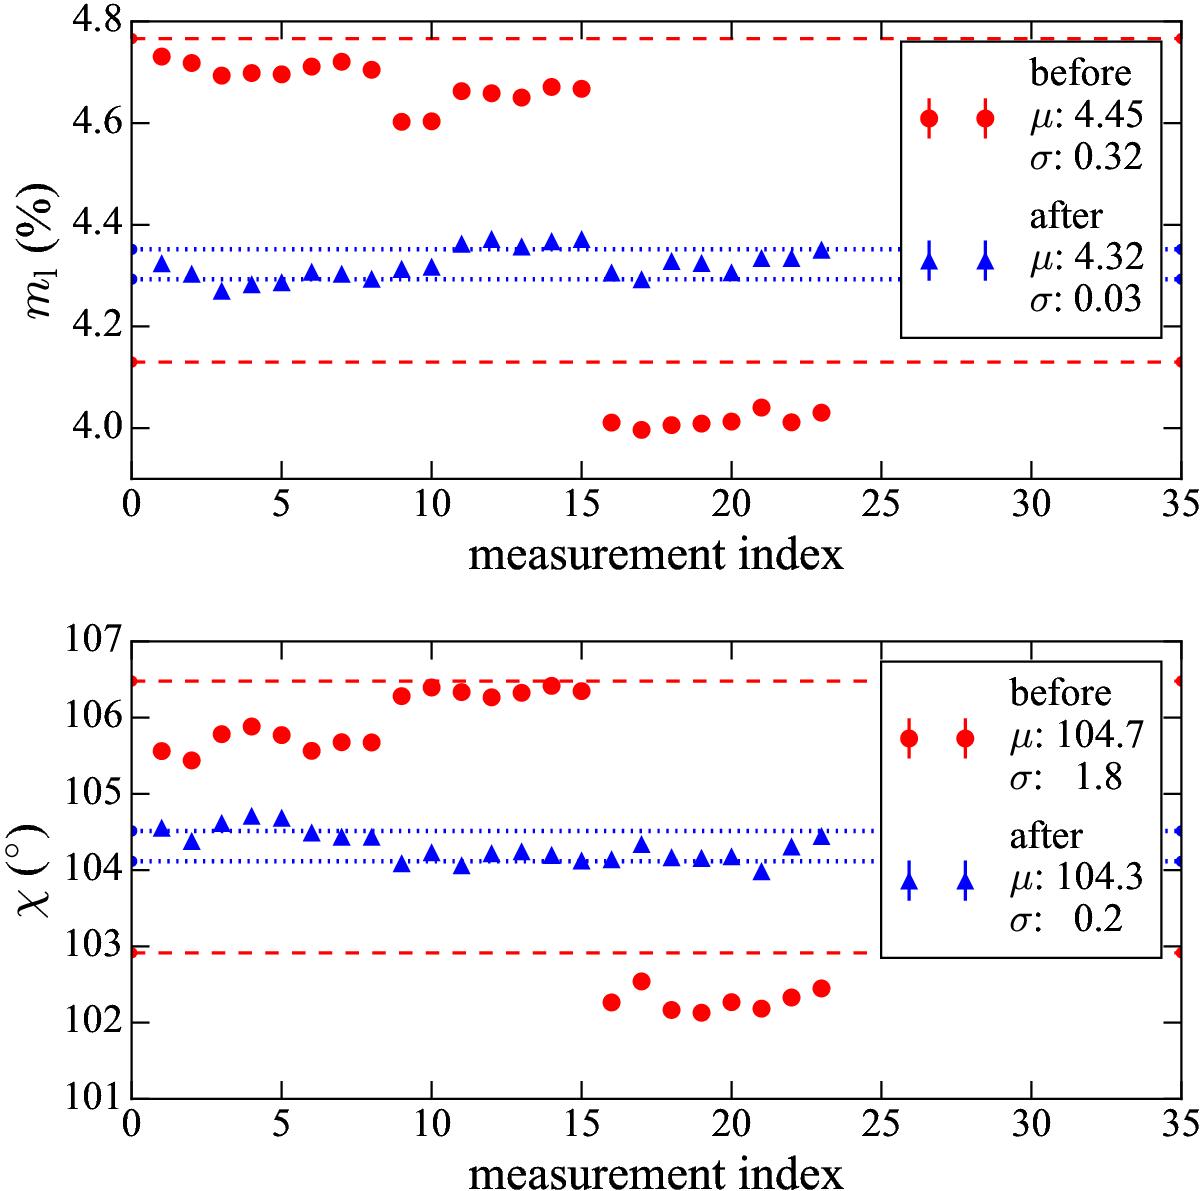
Degree of linear polarization (top panel) and polarization angle (bottom panel) of the source 3C 48 at 4.85 GHz before (red circles) and after (blue triangles) applying the instrumental linear polarization correction. The data correspond to 23 sub-scans of the source within a single observing session. The dashed red and dotted blue lines indicate the 1σ regions around the mean values of the uncorrected and corrected data sets, respectively. The mean, μ, and standard deviation, σ, values of the corresponding data sets are shown in the legend.
Current usage metrics show cumulative count of Article Views (full-text article views including HTML views, PDF and ePub downloads, according to the available data) and Abstracts Views on Vision4Press platform.
Data correspond to usage on the plateform after 2015. The current usage metrics is available 48-96 hours after online publication and is updated daily on week days.
Initial download of the metrics may take a while.