Fig. 5
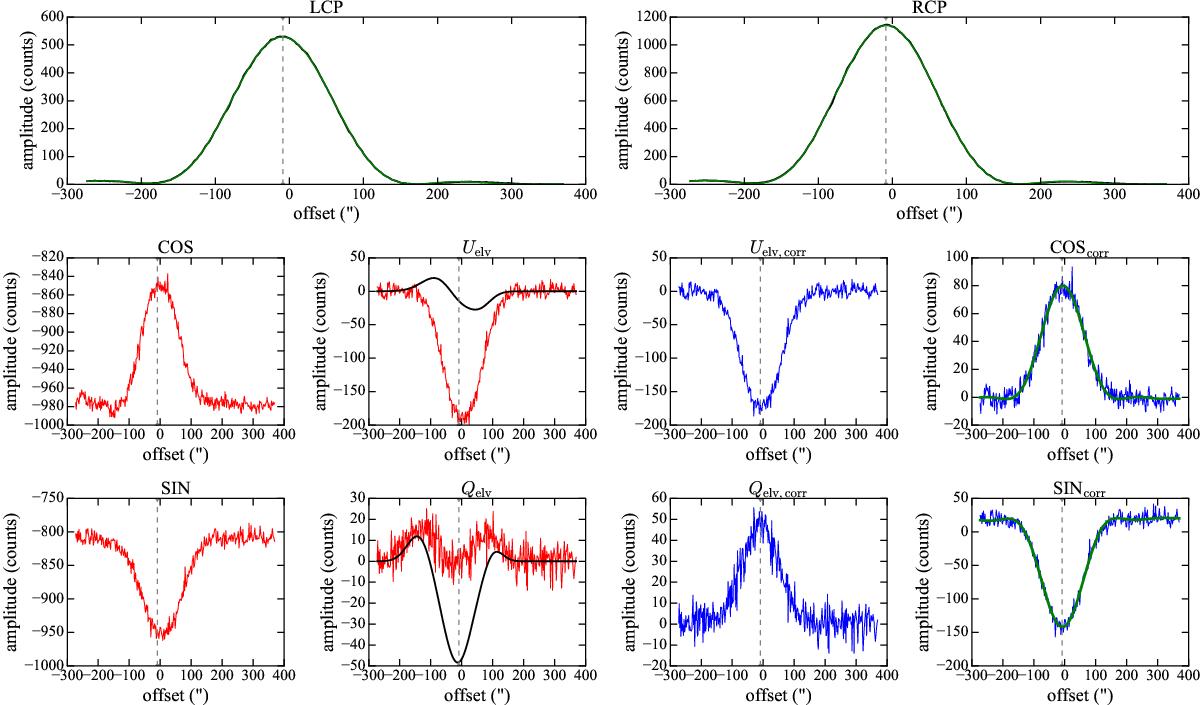
Example of the instrumental linear polarization correction for an elevation sub-scan at 4.85 GHz. The observed COS/SIN (or equivalently Qelv/Uelv) signals are shown with red in the middle and bottom rows, immediately below the LCP signal, while the corrected signals are shown with blue immediately below the RCP signal. The correction is performed by subtracting the expected instrumental polarization signals (smooth black lines) from the observed Qelv and Uelv data sets (2nd and 3rd column of the middle and bottom rows). The instrumental polarization signals are calculated by substituting the measured mean amplitude I, peak offset μ, and FWHM σ of the LCP and RCP signals (top row) in the instrument model M created for the given observing session.
Current usage metrics show cumulative count of Article Views (full-text article views including HTML views, PDF and ePub downloads, according to the available data) and Abstracts Views on Vision4Press platform.
Data correspond to usage on the plateform after 2015. The current usage metrics is available 48-96 hours after online publication and is updated daily on week days.
Initial download of the metrics may take a while.