Fig. 4
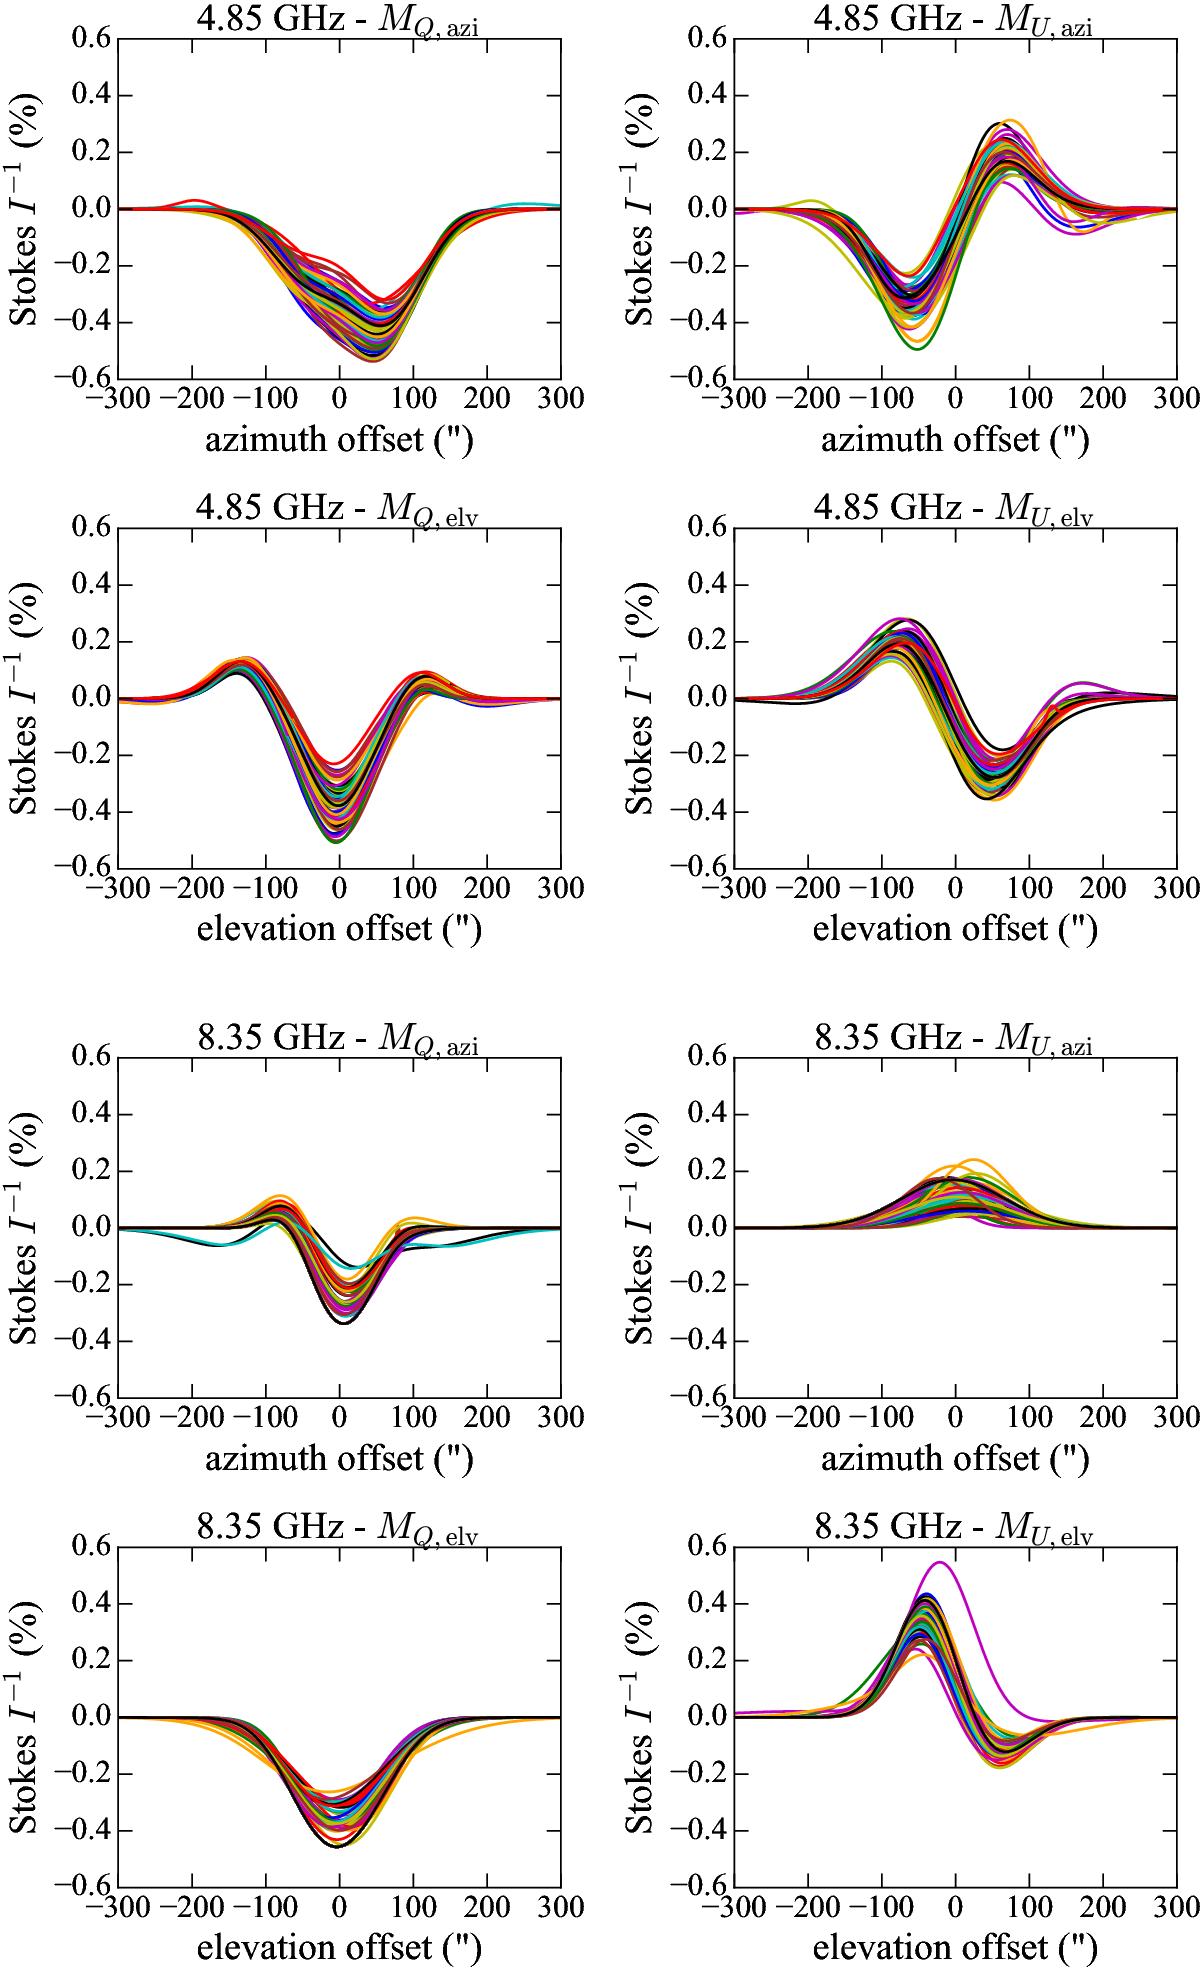
Generated Stokes Q and U instrument models in the two scanning directions, the azimuth in the top panels and the elevation in the bottom panels for (a) the 4.85 GHz (upper two rows) and (b) 8.35 GHz (lower two rows) receivers. The models were generated for 65 observing sessions. The variability of the plotted models is comparable to the respective errors of the fit.
Current usage metrics show cumulative count of Article Views (full-text article views including HTML views, PDF and ePub downloads, according to the available data) and Abstracts Views on Vision4Press platform.
Data correspond to usage on the plateform after 2015. The current usage metrics is available 48-96 hours after online publication and is updated daily on week days.
Initial download of the metrics may take a while.