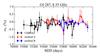
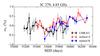
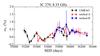
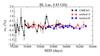
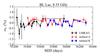
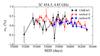
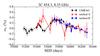
Fig. C.1
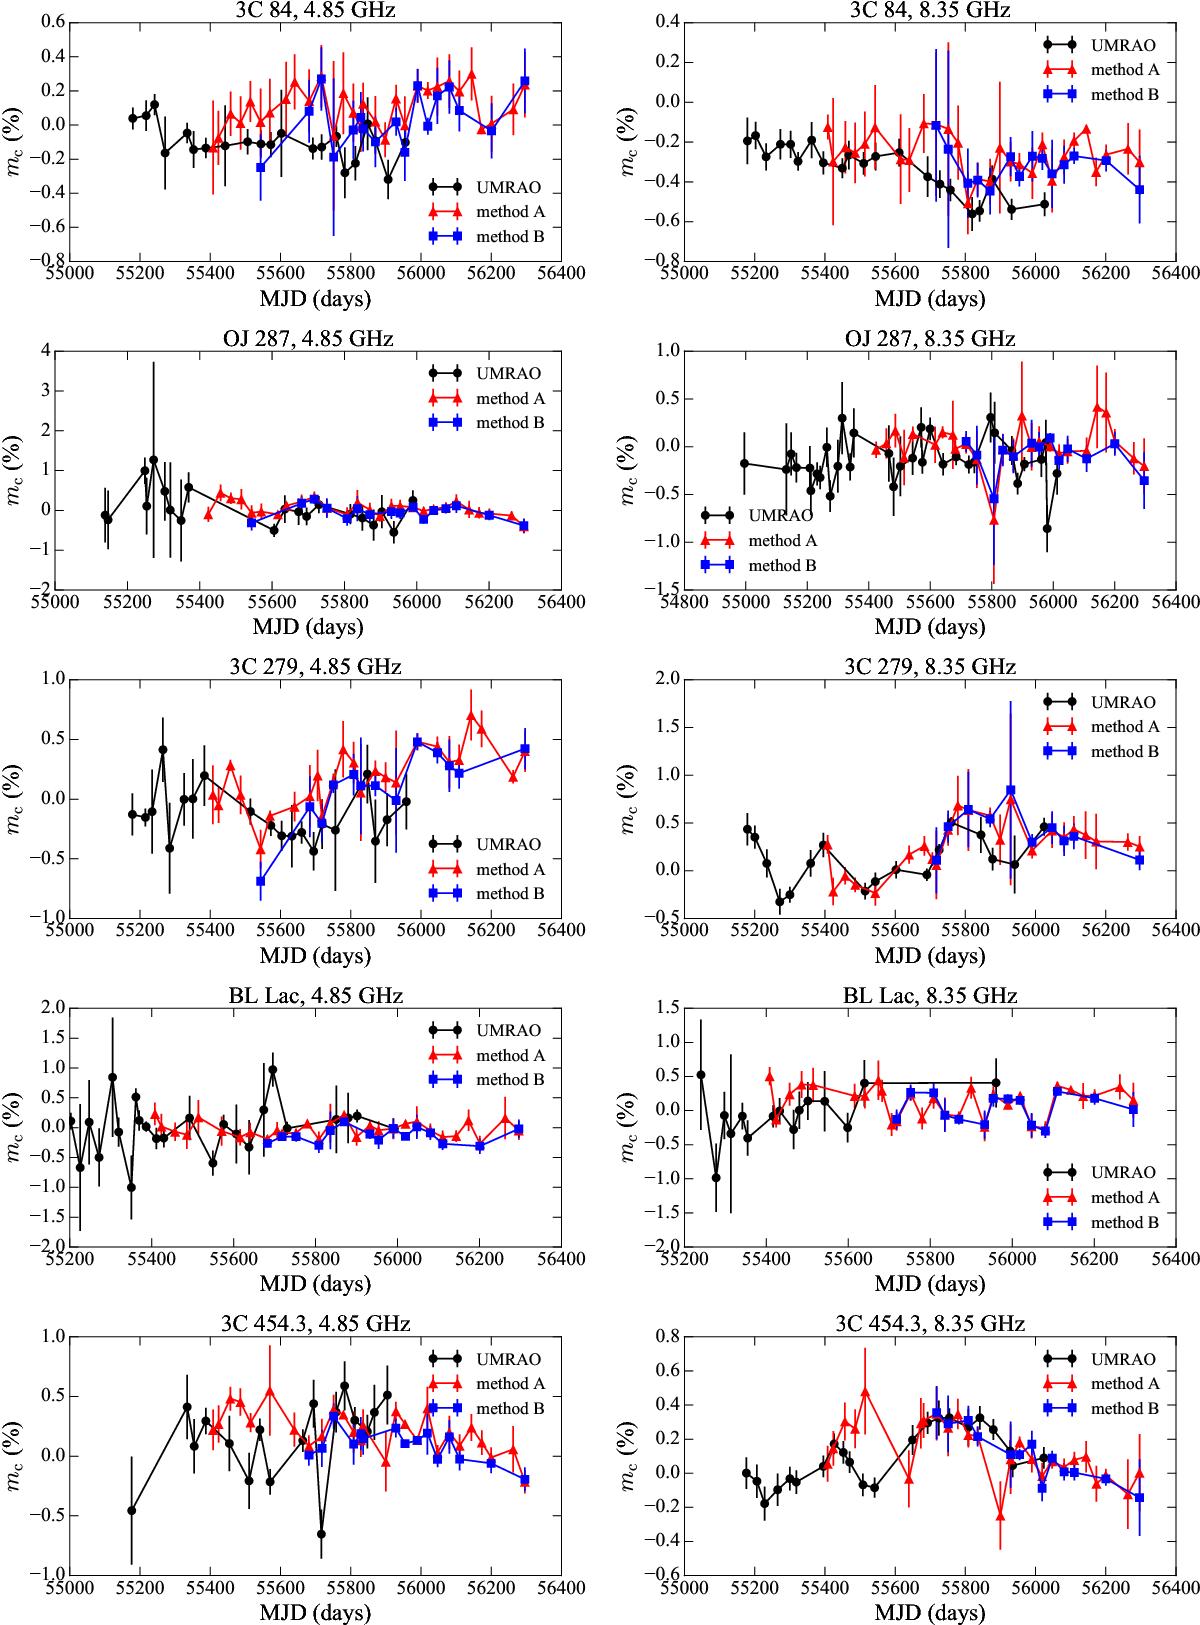
Circular polarization curves of the UMRAO data set (black circles) over-plotted against our results using both calibration methods A (red triangles) and B (blue squares) as described in Sect. 3.7. The comparison is performed over five sources with overlapping data sets, which were observed at 4.85 GHz (left column) and 8.35 GHz (right column). The data are available at the CDS.
Current usage metrics show cumulative count of Article Views (full-text article views including HTML views, PDF and ePub downloads, according to the available data) and Abstracts Views on Vision4Press platform.
Data correspond to usage on the plateform after 2015. The current usage metrics is available 48-96 hours after online publication and is updated daily on week days.
Initial download of the metrics may take a while.