Fig. 12
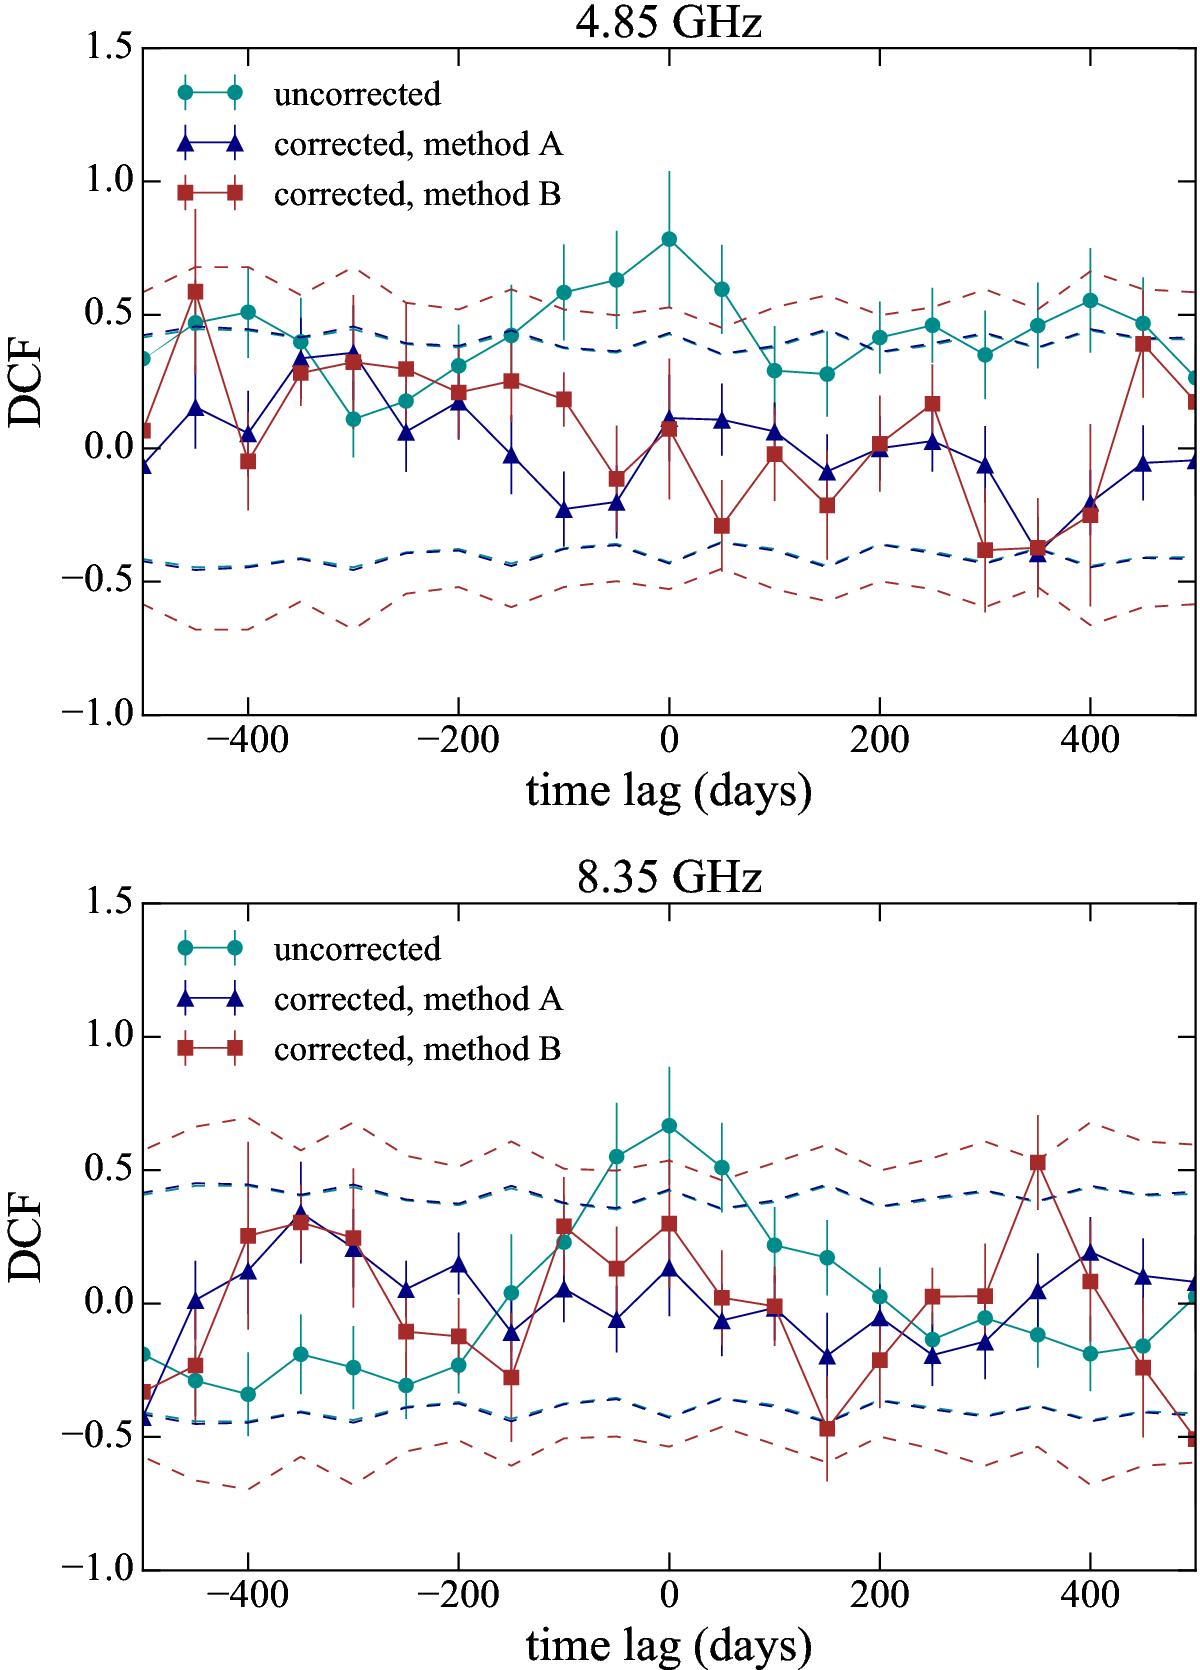
Discrete correlation function (DCF) between the mc light curves of 4C +38.41 and CTA 102 before (cyan circles) and after the instrumental circular polarization correction using either method A (blue triangles) or method B (red squares) as described in the text. The corresponding 3σ significance levels are shown with dashed lines.
Current usage metrics show cumulative count of Article Views (full-text article views including HTML views, PDF and ePub downloads, according to the available data) and Abstracts Views on Vision4Press platform.
Data correspond to usage on the plateform after 2015. The current usage metrics is available 48-96 hours after online publication and is updated daily on week days.
Initial download of the metrics may take a while.