Free Access
Fig. 1
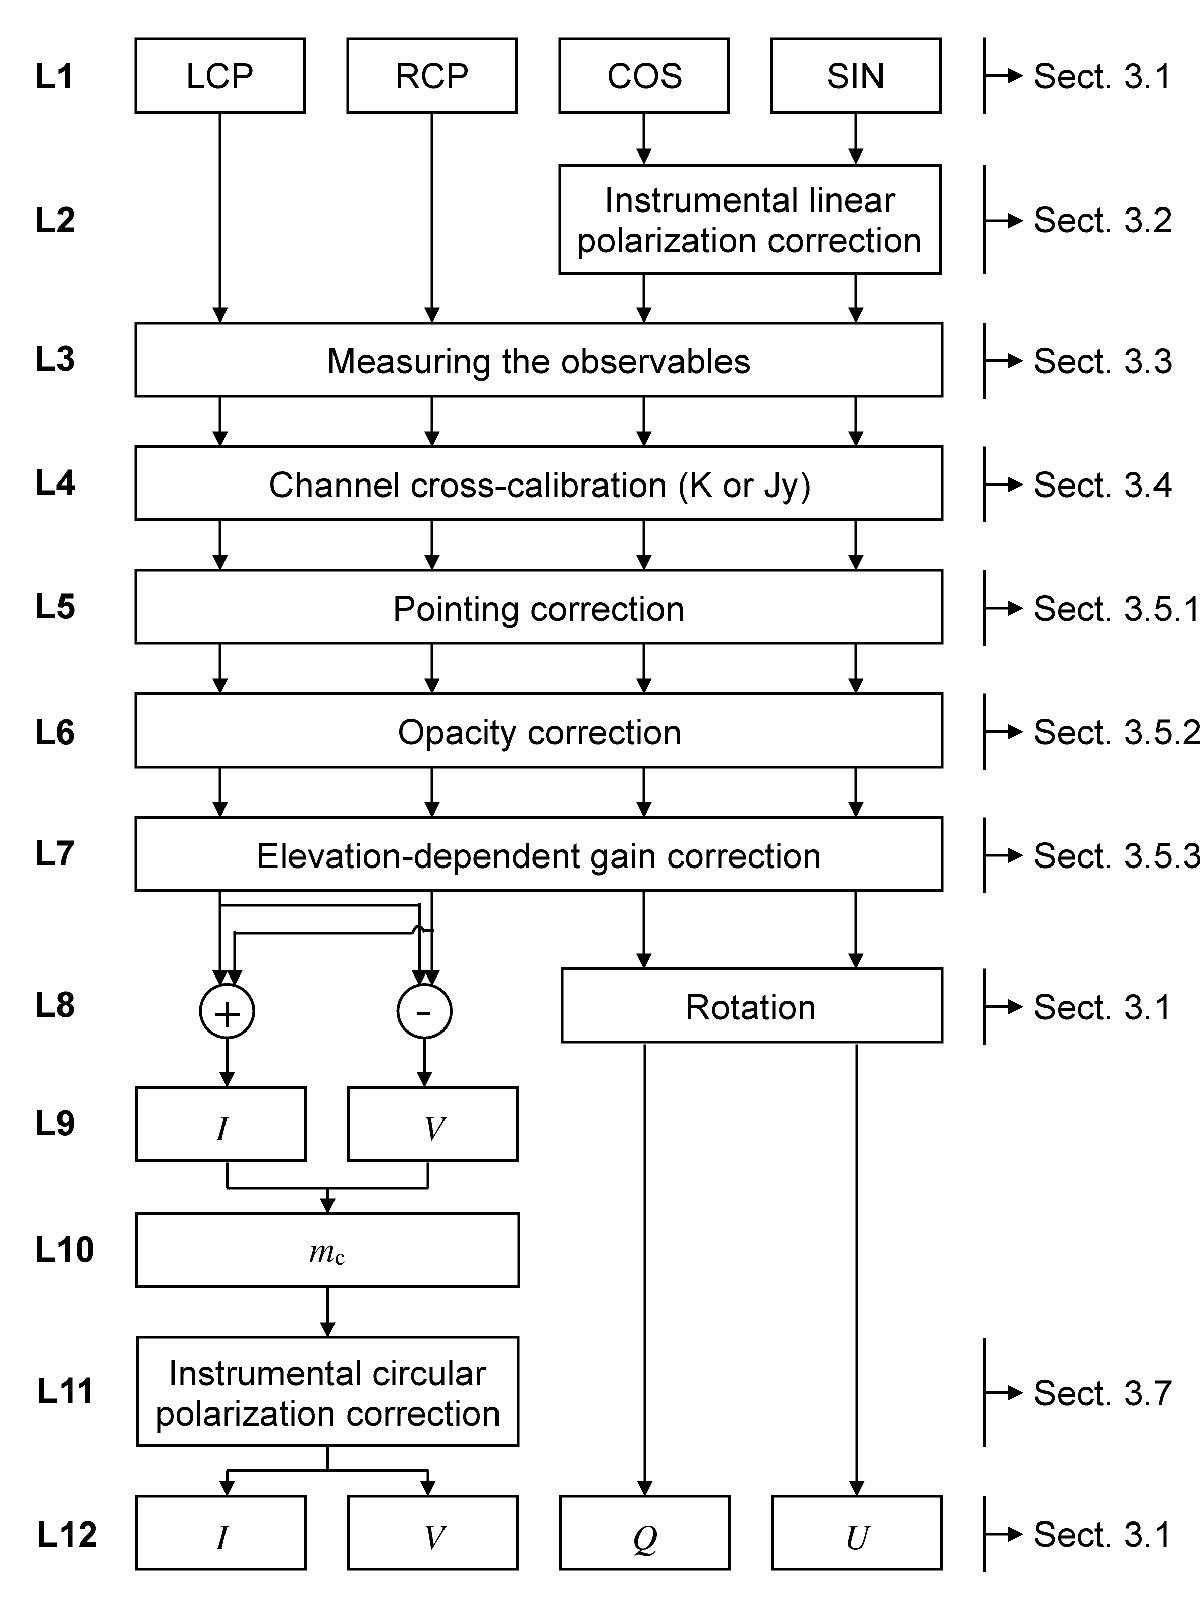
Schematic summary of the analysis sequence. Each analysis level is labeled with an index on the left and is discussed in the section noted on the right. The mean effect of each correction step is listed in Table 3.
Current usage metrics show cumulative count of Article Views (full-text article views including HTML views, PDF and ePub downloads, according to the available data) and Abstracts Views on Vision4Press platform.
Data correspond to usage on the plateform after 2015. The current usage metrics is available 48-96 hours after online publication and is updated daily on week days.
Initial download of the metrics may take a while.