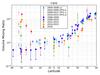
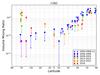
Fig. 9
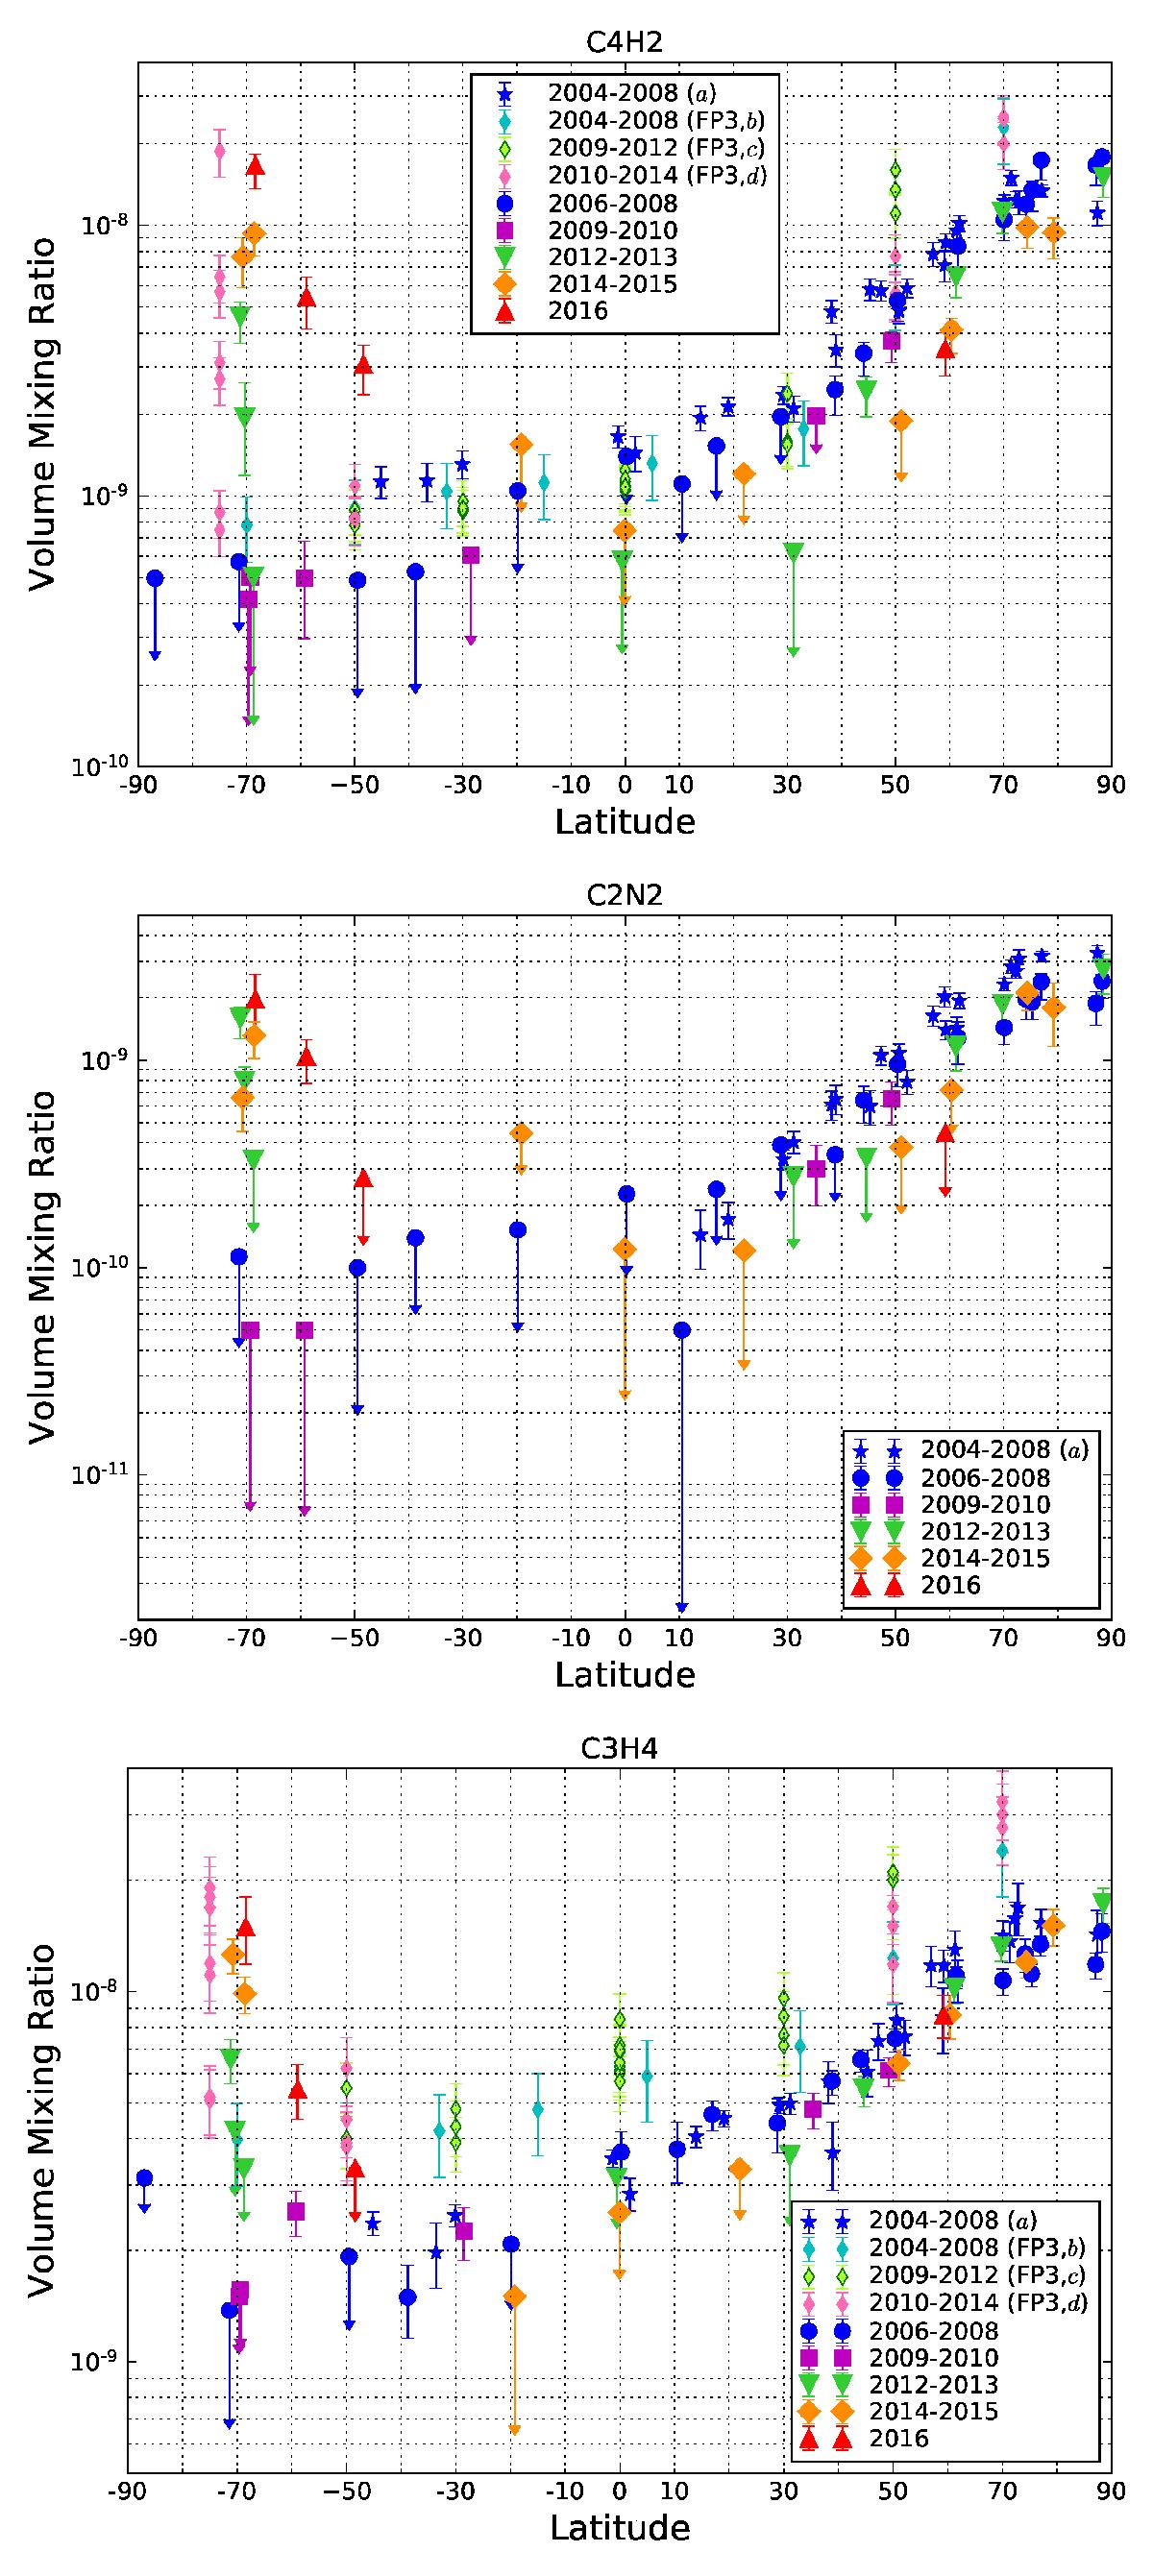
Meridional distributions of C4H2, C2N2, and C3H4 from 2006 (northern winter) to 2014 (mid-northern spring) at 15 mbar (or an altitude of ~85 km). “a” refers to Teanby et al. (2009a), where the same gases as in this study were measured with the same CIRS detector (FP1); “b”, “c”, and “d” respectively refer to Coustenis et al. (2010), Bampasidis et al. (2012), and Coustenis et al. (2016), C4H2 and C3H4 were measured with the CIRS detector FP3, probing slightly higher pressure levels (10 mbar) than this study. In the south pole, from 2006 to 2015, the volume mixing ratios of the three species strongly increased, while the other latitudes exhibit weak seasonal variations. Unlike C4H2 and C3H4, C2N2 abundance at mid-northern latitudes decreases from 2012. Error bars show relative errors as derived in Sect. 3.6.
Current usage metrics show cumulative count of Article Views (full-text article views including HTML views, PDF and ePub downloads, according to the available data) and Abstracts Views on Vision4Press platform.
Data correspond to usage on the plateform after 2015. The current usage metrics is available 48-96 hours after online publication and is updated daily on week days.
Initial download of the metrics may take a while.