Fig. 7
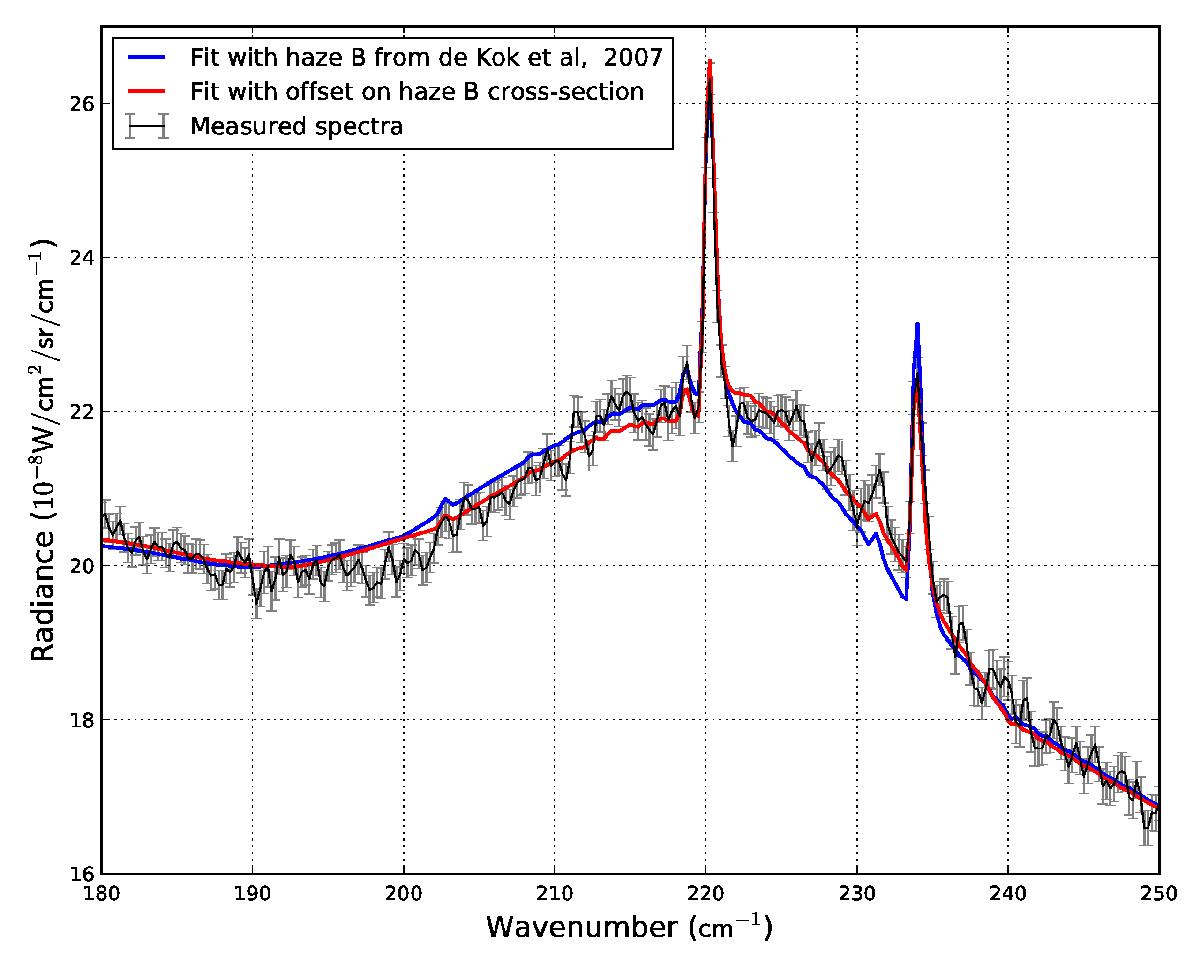
Fits of a high latitude spectrum during winter. The black spectrum was measured with FP1 at 89°N in March 2007. The blue and red lines indicate respectively the fits of this spectrum with the haze B cross-sections as measured by de Kok et al. (2007) and with the addition of a small offset (2.5 cm-1) to haze B cross-sections from 190 cm-1 to 240 cm-1. Without this correction, the continuum is overestimated by NEMESIS around the C4H2 band and underestimated around the C2N2 band.
Current usage metrics show cumulative count of Article Views (full-text article views including HTML views, PDF and ePub downloads, according to the available data) and Abstracts Views on Vision4Press platform.
Data correspond to usage on the plateform after 2015. The current usage metrics is available 48-96 hours after online publication and is updated daily on week days.
Initial download of the metrics may take a while.