Fig. 6
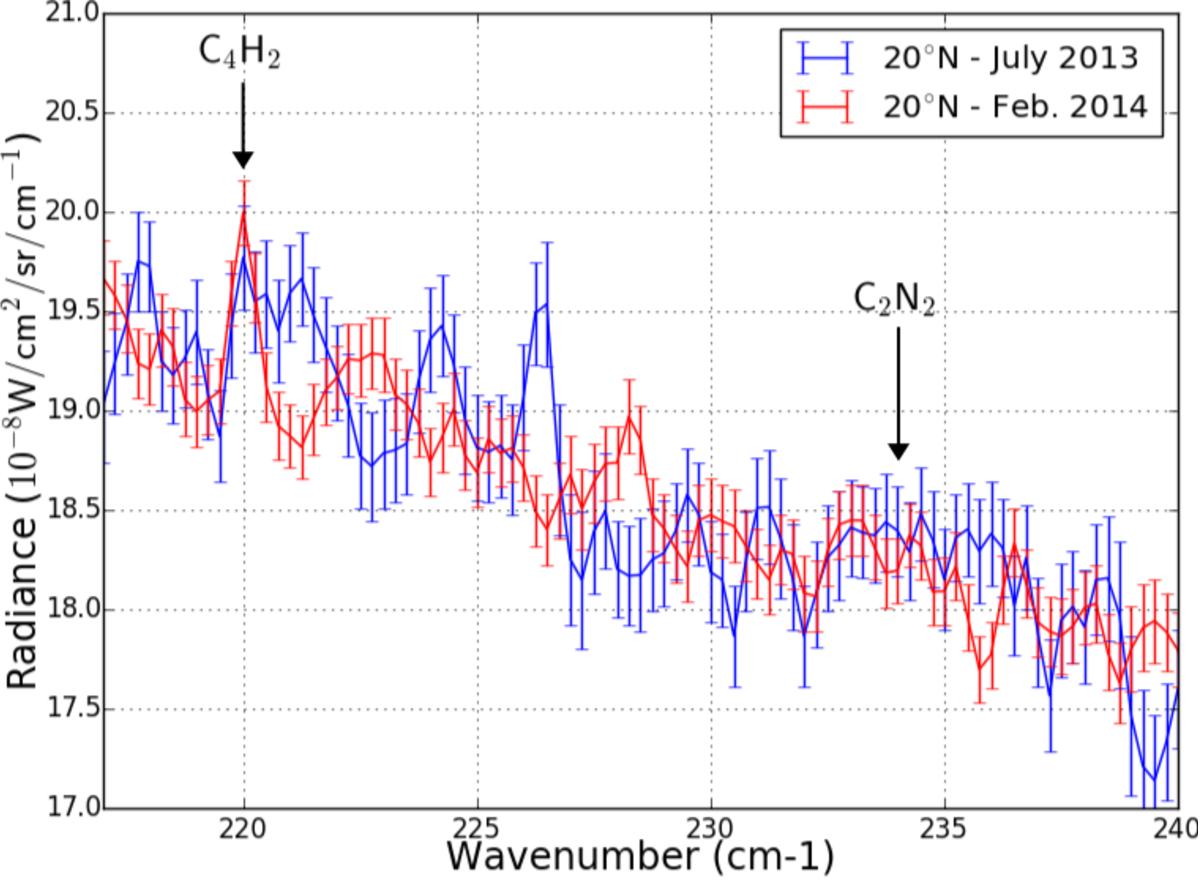
Spectra measured at 20°N in July 2013 (blue) and February 2014 (red), between 217 cm-1 and 240 cm-1. Here we show the error bars from the photometric calibration provided by the CIRS team. These error bars are too small to take into account the spurious noise features in each spectrum or some of the radiance differences between these two spectra.
Current usage metrics show cumulative count of Article Views (full-text article views including HTML views, PDF and ePub downloads, according to the available data) and Abstracts Views on Vision4Press platform.
Data correspond to usage on the plateform after 2015. The current usage metrics is available 48-96 hours after online publication and is updated daily on week days.
Initial download of the metrics may take a while.