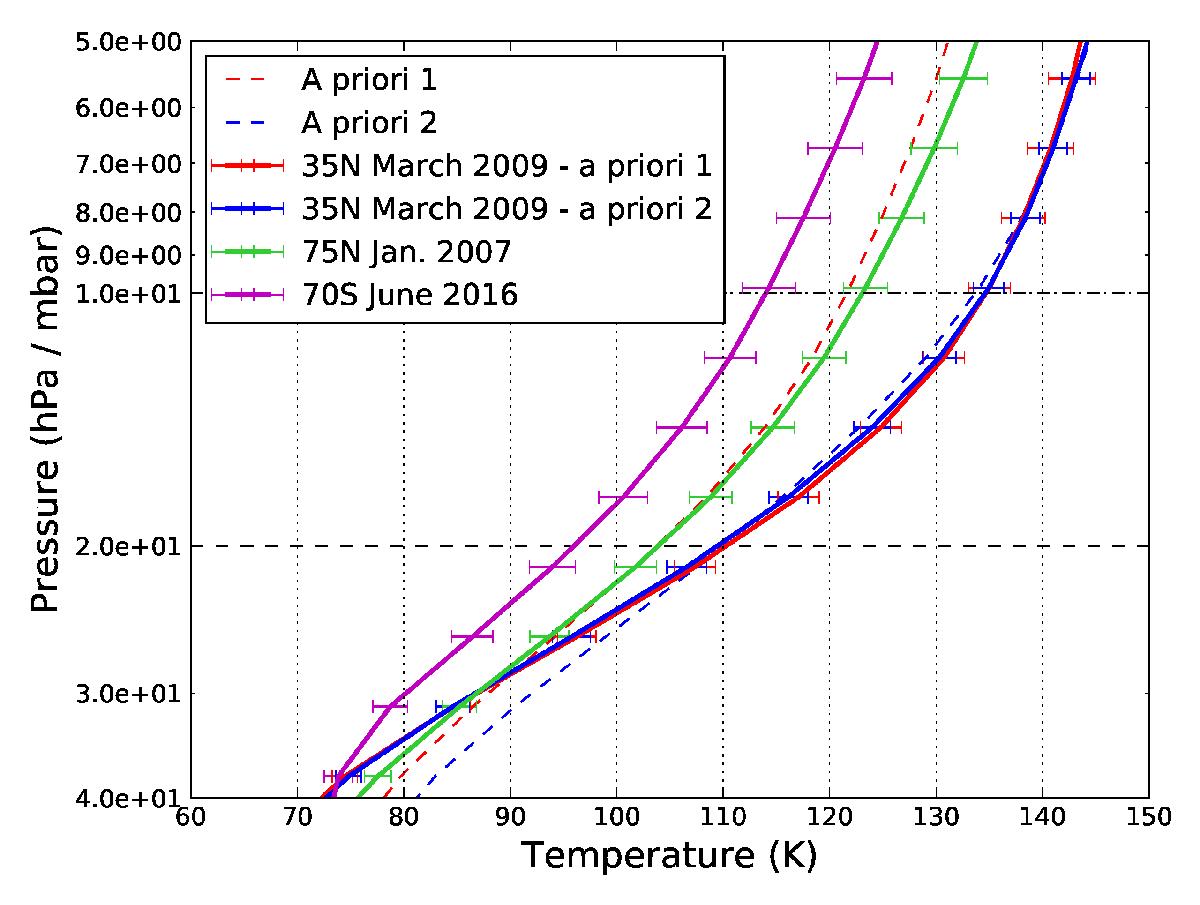
Fig. 5

Examples of temperature profiles over the whole range of temperature profiles retrieved in this study. For the observations at 35°N in March 2009, we show temperature profiles obtained with two different a priori profiles. A priori 1 is a temperature profile measured by Achterberg et al. (2008), while a priori 2 is the profile retrieved from FP4 observations performed at 30°N in June 2009. Black horizontal dashed lines show the sensitivity limits of the FP1 temperature retrievals. Error bars on the profiles do not take into account the errors related to CH4 variations (see Sect. 3.6).
Current usage metrics show cumulative count of Article Views (full-text article views including HTML views, PDF and ePub downloads, according to the available data) and Abstracts Views on Vision4Press platform.
Data correspond to usage on the plateform after 2015. The current usage metrics is available 48-96 hours after online publication and is updated daily on week days.
Initial download of the metrics may take a while.


