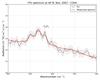
Fig. 2
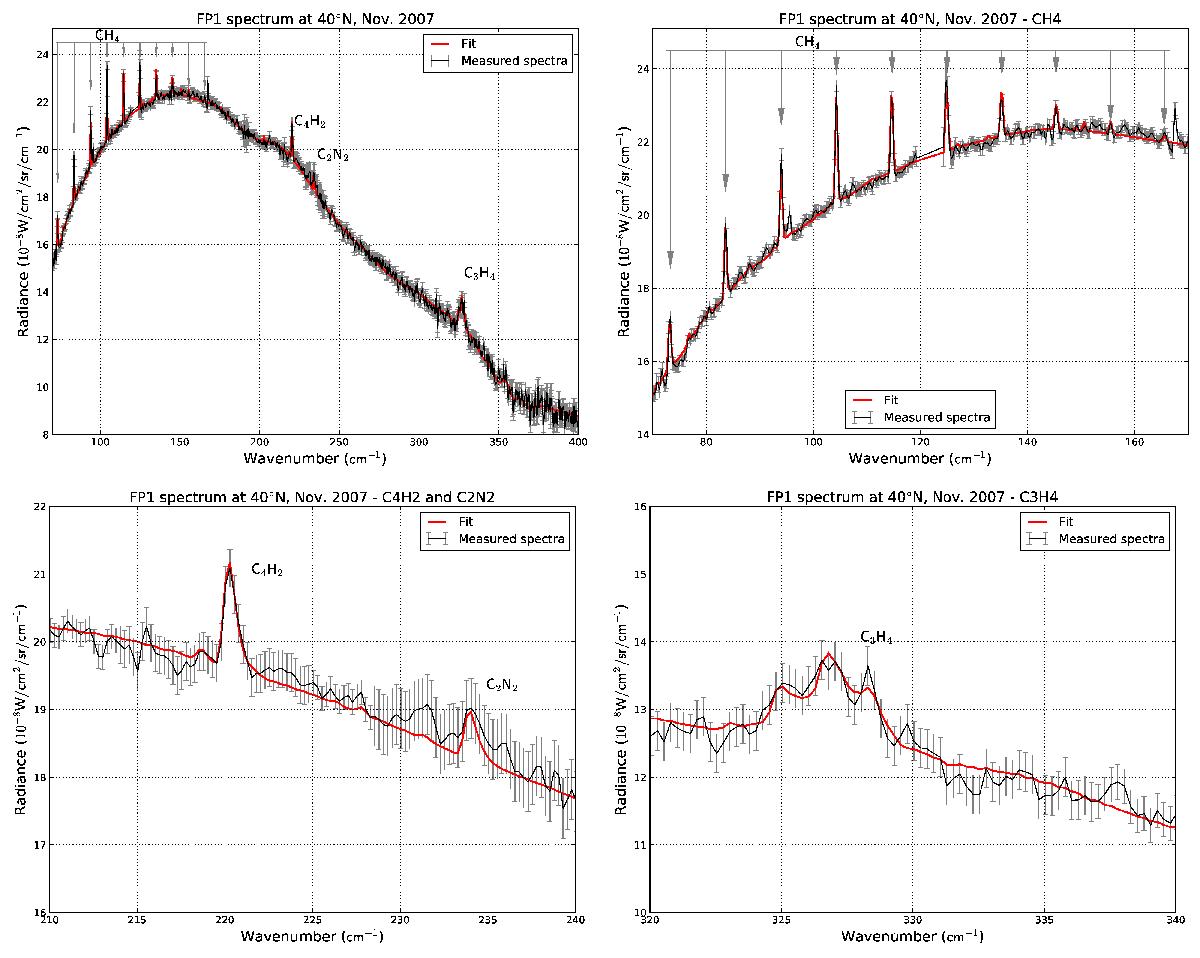
Example of FP1 spectrum (after average). The top left panel shows the whole spectrum while the three other panels are a close-up around the relevant spectral bands. Measured spectra are in black. Red solid lines show the synthetic spectra calculated during the retrieval process. Data were acquired at a spectral resolution of 0.5 cm-1. Error bars of the FP1 spectrum have been corrected because the initial error bars were too small with respect to the radiance variations caused by noise (see Sects. 2 and 3.3). C4H2, C2N2, and C3H4 bands are visible, and allow us to retrieve the volume mixing ratios of these species. The CH4 bands in FP1 are used to retrieve the temperature profile between 20 mbar and 10 mbar.
Current usage metrics show cumulative count of Article Views (full-text article views including HTML views, PDF and ePub downloads, according to the available data) and Abstracts Views on Vision4Press platform.
Data correspond to usage on the plateform after 2015. The current usage metrics is available 48-96 hours after online publication and is updated daily on week days.
Initial download of the metrics may take a while.