Fig. 10
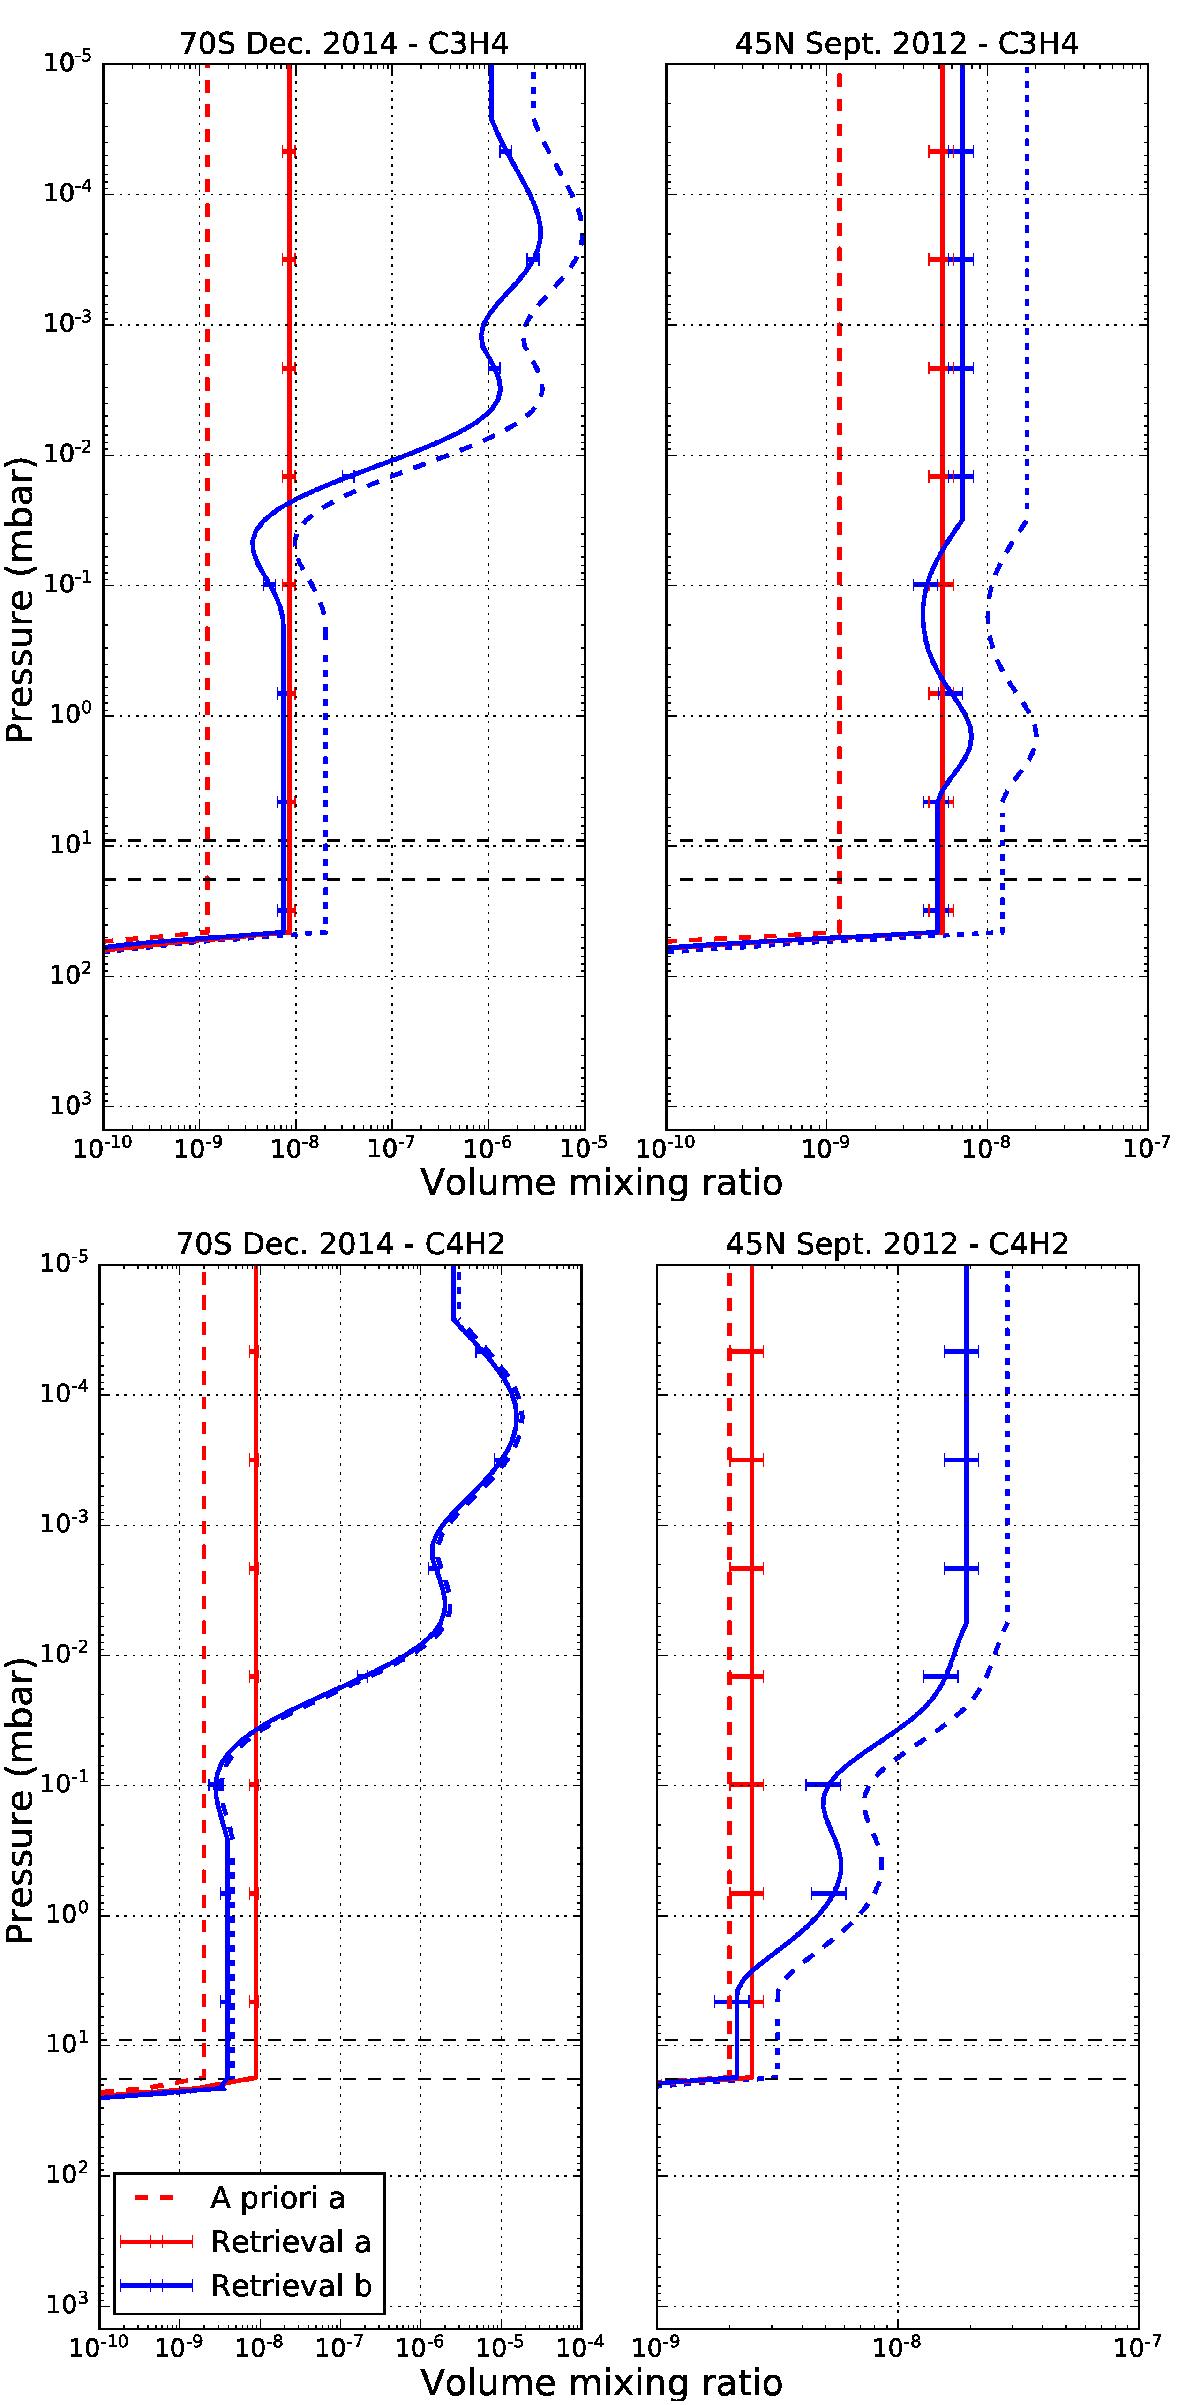
Vertical profiles of C3H4 (top panels) and C4H2 (bottom panels) retrieved at 70°S in December 2014 (left panels) and 45°N in September 2012 (right panels). Vertical profiles from retrievals (a) and their a priori are respectively represented by red solid and dashed lines. Vertical profiles from retrievals (b) are represented by blue solid lines. A priori profiles for retrievals (b) are represented by blue dashed lines within the pressure range probed by the CIRS limb observations, and by blue dotted lines outside this pressure range. Thin black dashed lines show the pressure range probed by our CIRS nadir observations. The limb profiles on the left and right panels (blue dashed lines) were respectively measured at 79°S in September 2014 and 46°N in June 2012. At the pressure levels probed by our observations, retrievals (a) and (b) give consistent results, except for C4H2 at 70°S in December 2014, because of the high vertical gradient of the a priori profile (b).
Current usage metrics show cumulative count of Article Views (full-text article views including HTML views, PDF and ePub downloads, according to the available data) and Abstracts Views on Vision4Press platform.
Data correspond to usage on the plateform after 2015. The current usage metrics is available 48-96 hours after online publication and is updated daily on week days.
Initial download of the metrics may take a while.