Fig. 15
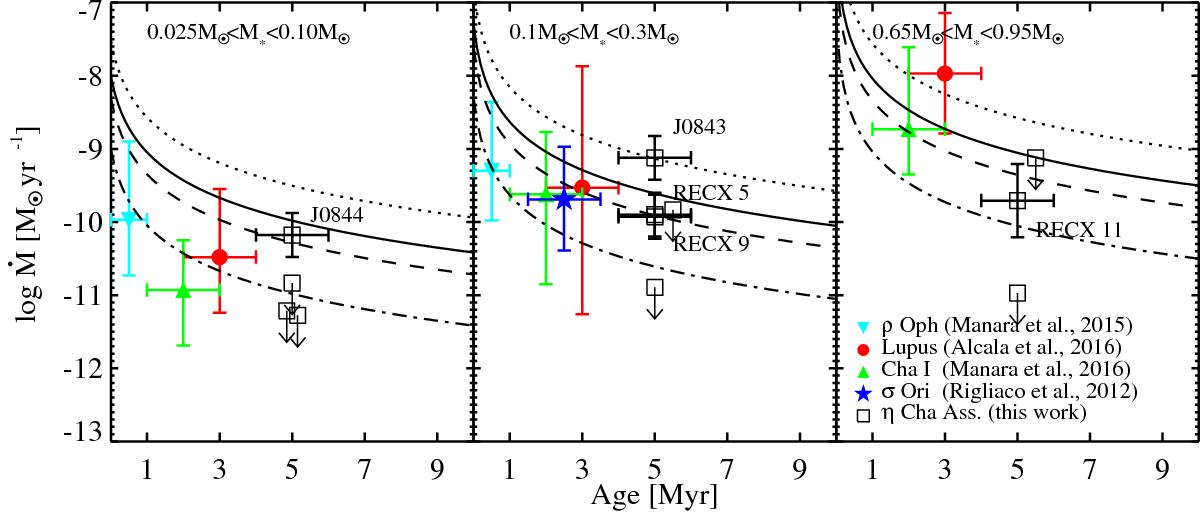
Mass accretion rate vs. cluster age for three different stellar mass ranges. The ranges are indicated in each panel. Stars in the η Cha association are shown as empty black squares. Upper limits are drawn as arrows for objects with no detected accretion, otherwise colors and symbols as in Fig. 14. The dotted, solid, dashed and dash-dotted lines indicate fiducial models for viscous accretion with disk masses of 30%, 10%, 5%, and 1% of the mass of the central star, respectively. The stellar mass used in the model is M∗ = 0.05 M⊙ in the left, M∗ = 0.15 M⊙ in the middle, and M∗ = 0.8 M⊙ in the right panel (see details and references in text).
Current usage metrics show cumulative count of Article Views (full-text article views including HTML views, PDF and ePub downloads, according to the available data) and Abstracts Views on Vision4Press platform.
Data correspond to usage on the plateform after 2015. The current usage metrics is available 48-96 hours after online publication and is updated daily on week days.
Initial download of the metrics may take a while.