Fig. 14
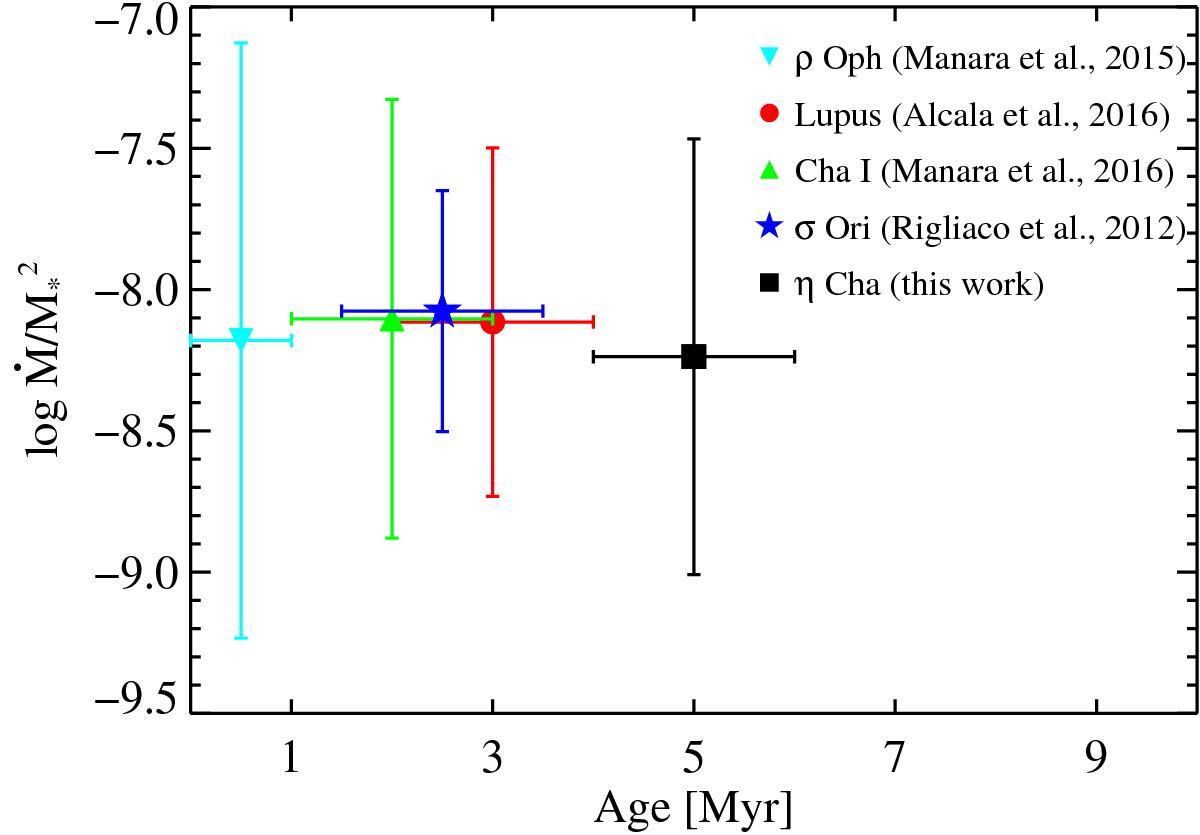
Mass accretion rates normalized by stellar mass squared at cluster ages of individual star forming regions. The mass accretion rate Ṁ of each star has been divided by ![]() and combined by the median for each cluster. Ṁ is given in units of M⊙/ yr and the stellar mass M∗ is given in units of M⊙. Stars in the η Cha association are shown as filled black square. The other clusters are shown as a cyan inverted triangle for ρ Ophiucus, as a red circle for Lupus, as a green triangle for Chamaeleon I, and as a blue star for σ Orionis. The error bars indicate the standard deviation in logarithmic scale of the normalized mass accretion rates.
and combined by the median for each cluster. Ṁ is given in units of M⊙/ yr and the stellar mass M∗ is given in units of M⊙. Stars in the η Cha association are shown as filled black square. The other clusters are shown as a cyan inverted triangle for ρ Ophiucus, as a red circle for Lupus, as a green triangle for Chamaeleon I, and as a blue star for σ Orionis. The error bars indicate the standard deviation in logarithmic scale of the normalized mass accretion rates.
Current usage metrics show cumulative count of Article Views (full-text article views including HTML views, PDF and ePub downloads, according to the available data) and Abstracts Views on Vision4Press platform.
Data correspond to usage on the plateform after 2015. The current usage metrics is available 48-96 hours after online publication and is updated daily on week days.
Initial download of the metrics may take a while.