Free Access
Fig. 10
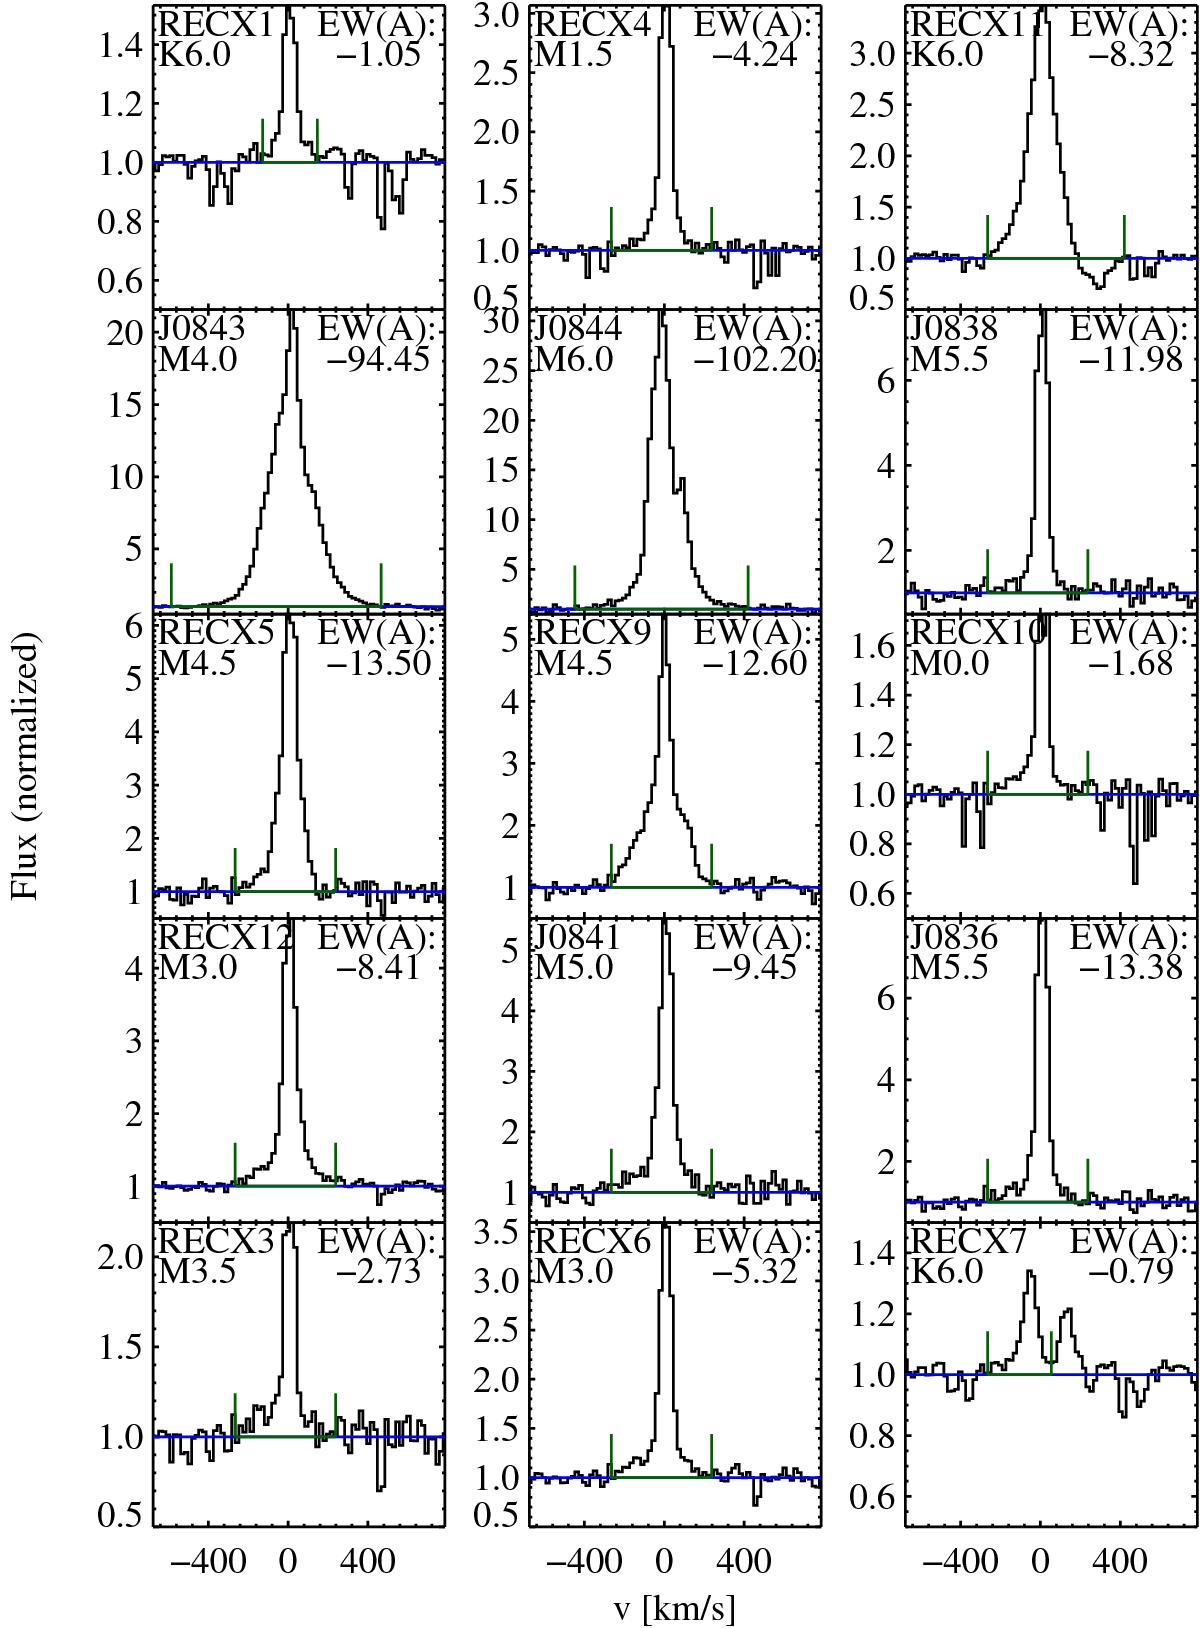
Continuum normalized Hα line profiles in the η Cha association. Green lines denote the integration boundaries for the determination of line flux and equivalent width. The continuum level is indicated by a blue line. Each panel shows the object’s name, its spectral type, and the measured equivalent width (EW).
Current usage metrics show cumulative count of Article Views (full-text article views including HTML views, PDF and ePub downloads, according to the available data) and Abstracts Views on Vision4Press platform.
Data correspond to usage on the plateform after 2015. The current usage metrics is available 48-96 hours after online publication and is updated daily on week days.
Initial download of the metrics may take a while.