Fig. 1
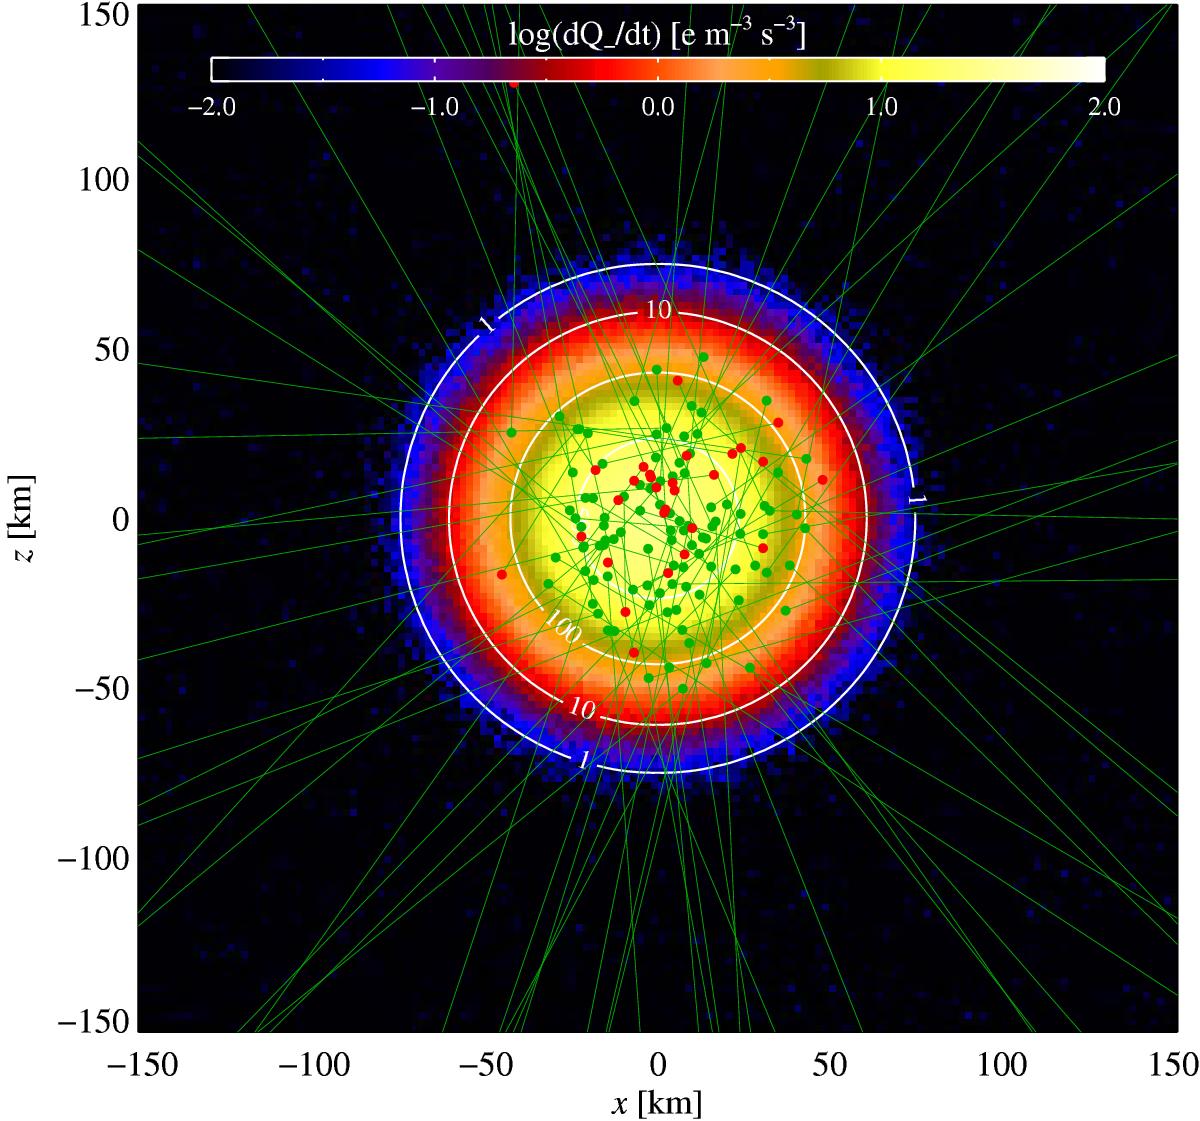
The charging rate by positron release in an axisymmetric pebble filament of half-width 20 km. The filament has a peak density of 1000 times the gas density and the background dust density is 0.1 times the gas density. The colored contours show the negative charging rate and the white contour lines show the dust-to-gas ratio. The charging rate has been obtained by a Monte Carlo calculation of the emission and absorption of 107 positrons. A hundred randomly picked positron trajectories are shown in green, released at the green dot and absorbed at the red dot (which happens mostly outside of the plotted region). The filament charges rapidly negative as most of the released positrons are absorbed in the surrounding gas.
Current usage metrics show cumulative count of Article Views (full-text article views including HTML views, PDF and ePub downloads, according to the available data) and Abstracts Views on Vision4Press platform.
Data correspond to usage on the plateform after 2015. The current usage metrics is available 48-96 hours after online publication and is updated daily on week days.
Initial download of the metrics may take a while.