Fig. 3
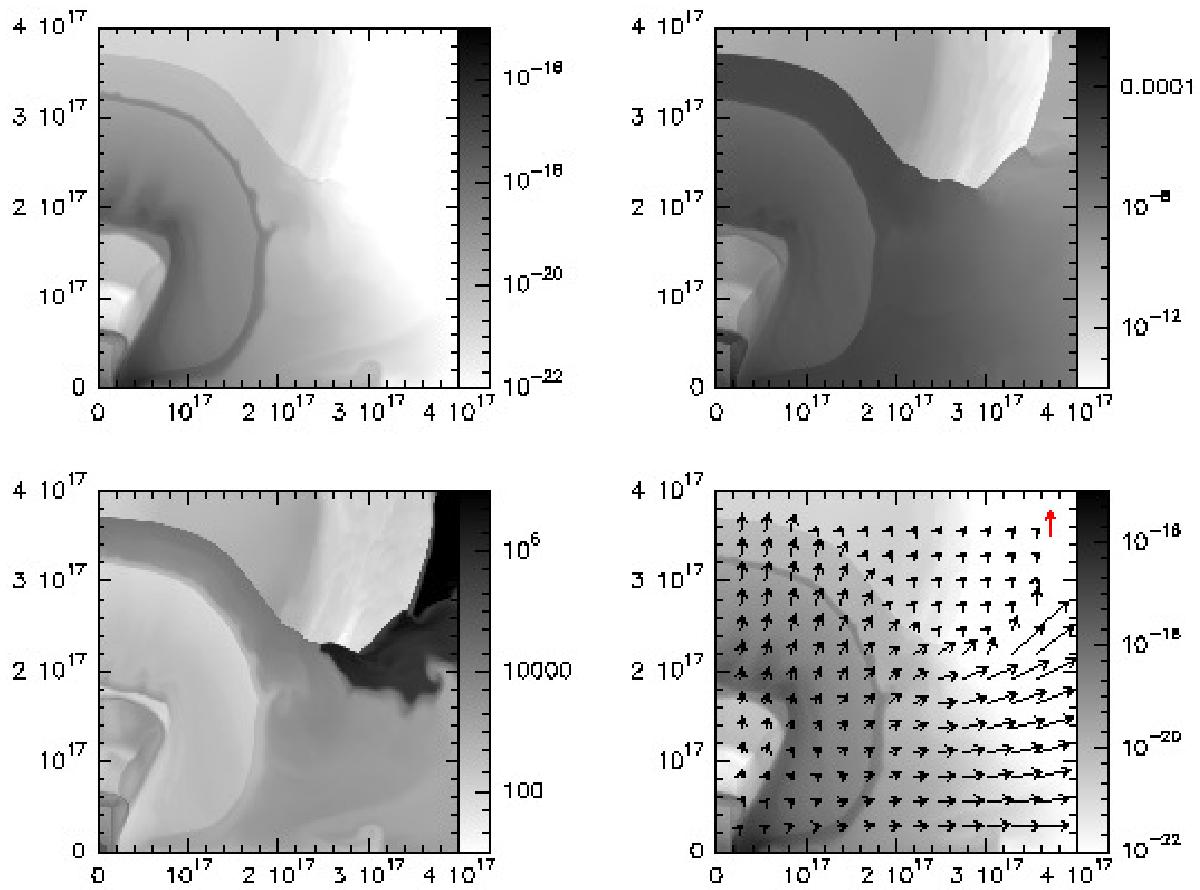
Stratifications in one quadrant of density (top left), pressure (top right), temperature (bottom left), and velocity field superposed on the density map (bottom right) for Run A computed 120 yr after the major eruption of η Car. The vertical red arrow shown in the velocity-field stratification corresponds to 1000 km s-1. The text gives a further description of the figure.
Current usage metrics show cumulative count of Article Views (full-text article views including HTML views, PDF and ePub downloads, according to the available data) and Abstracts Views on Vision4Press platform.
Data correspond to usage on the plateform after 2015. The current usage metrics is available 48-96 hours after online publication and is updated daily on week days.
Initial download of the metrics may take a while.