Fig. 2
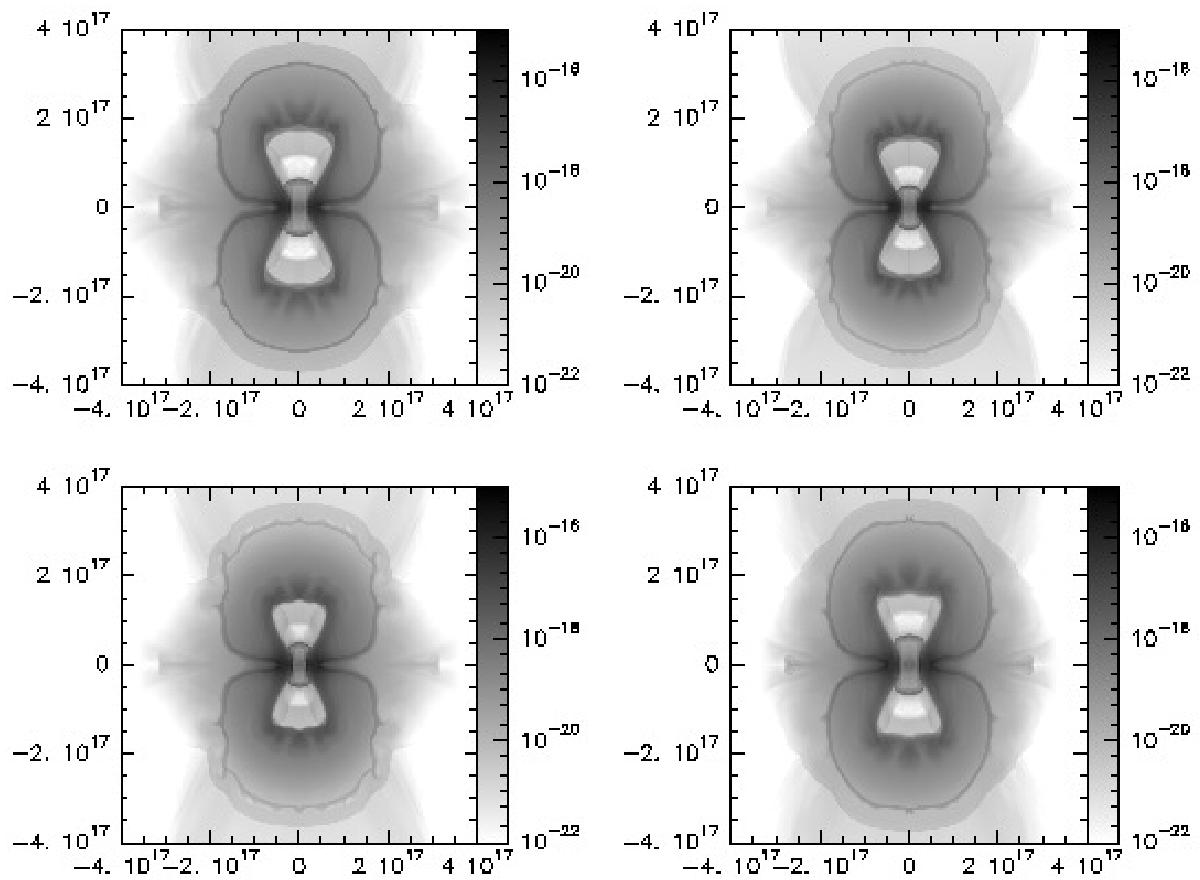
Predicted density maps of η Car’s nebula for Run A at a time t = 120 yr (top left), for Run B at t = 104 yr (top right), for Run C at t = 103 yr (bottom left), and for Run D at t = 121 yr (bottom right) after 1840s major eruption. The vertical bars at the right side of the plots depict the logarithmic grayscale of the density in g cm-3, and the computational domain axes are labeled in cm. A detailed description of the figure is presented in the text.
Current usage metrics show cumulative count of Article Views (full-text article views including HTML views, PDF and ePub downloads, according to the available data) and Abstracts Views on Vision4Press platform.
Data correspond to usage on the plateform after 2015. The current usage metrics is available 48-96 hours after online publication and is updated daily on week days.
Initial download of the metrics may take a while.