Free Access
Fig. 7
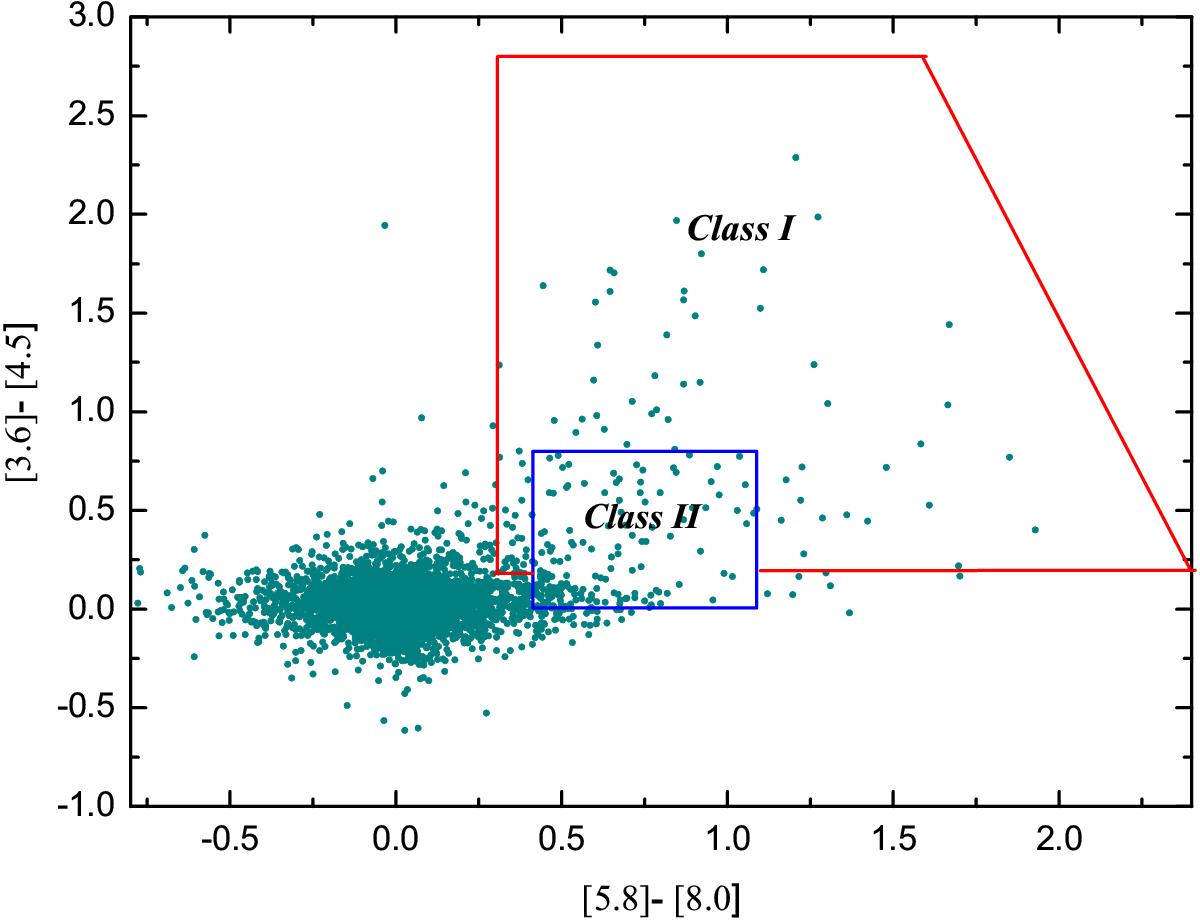
GLIMPSE color–color diagram [5.8]–[8.0] vs. [3.6]–[4.5] for all the selected sources in filament G47.06+0.26. Class I and II regions are indicated according to criteria given by Allen et al. (2004). Class I sources are protostars with circumstellar envelopes and Class II are disk-dominated objects.
Current usage metrics show cumulative count of Article Views (full-text article views including HTML views, PDF and ePub downloads, according to the available data) and Abstracts Views on Vision4Press platform.
Data correspond to usage on the plateform after 2015. The current usage metrics is available 48-96 hours after online publication and is updated daily on week days.
Initial download of the metrics may take a while.