Free Access
Fig. 6
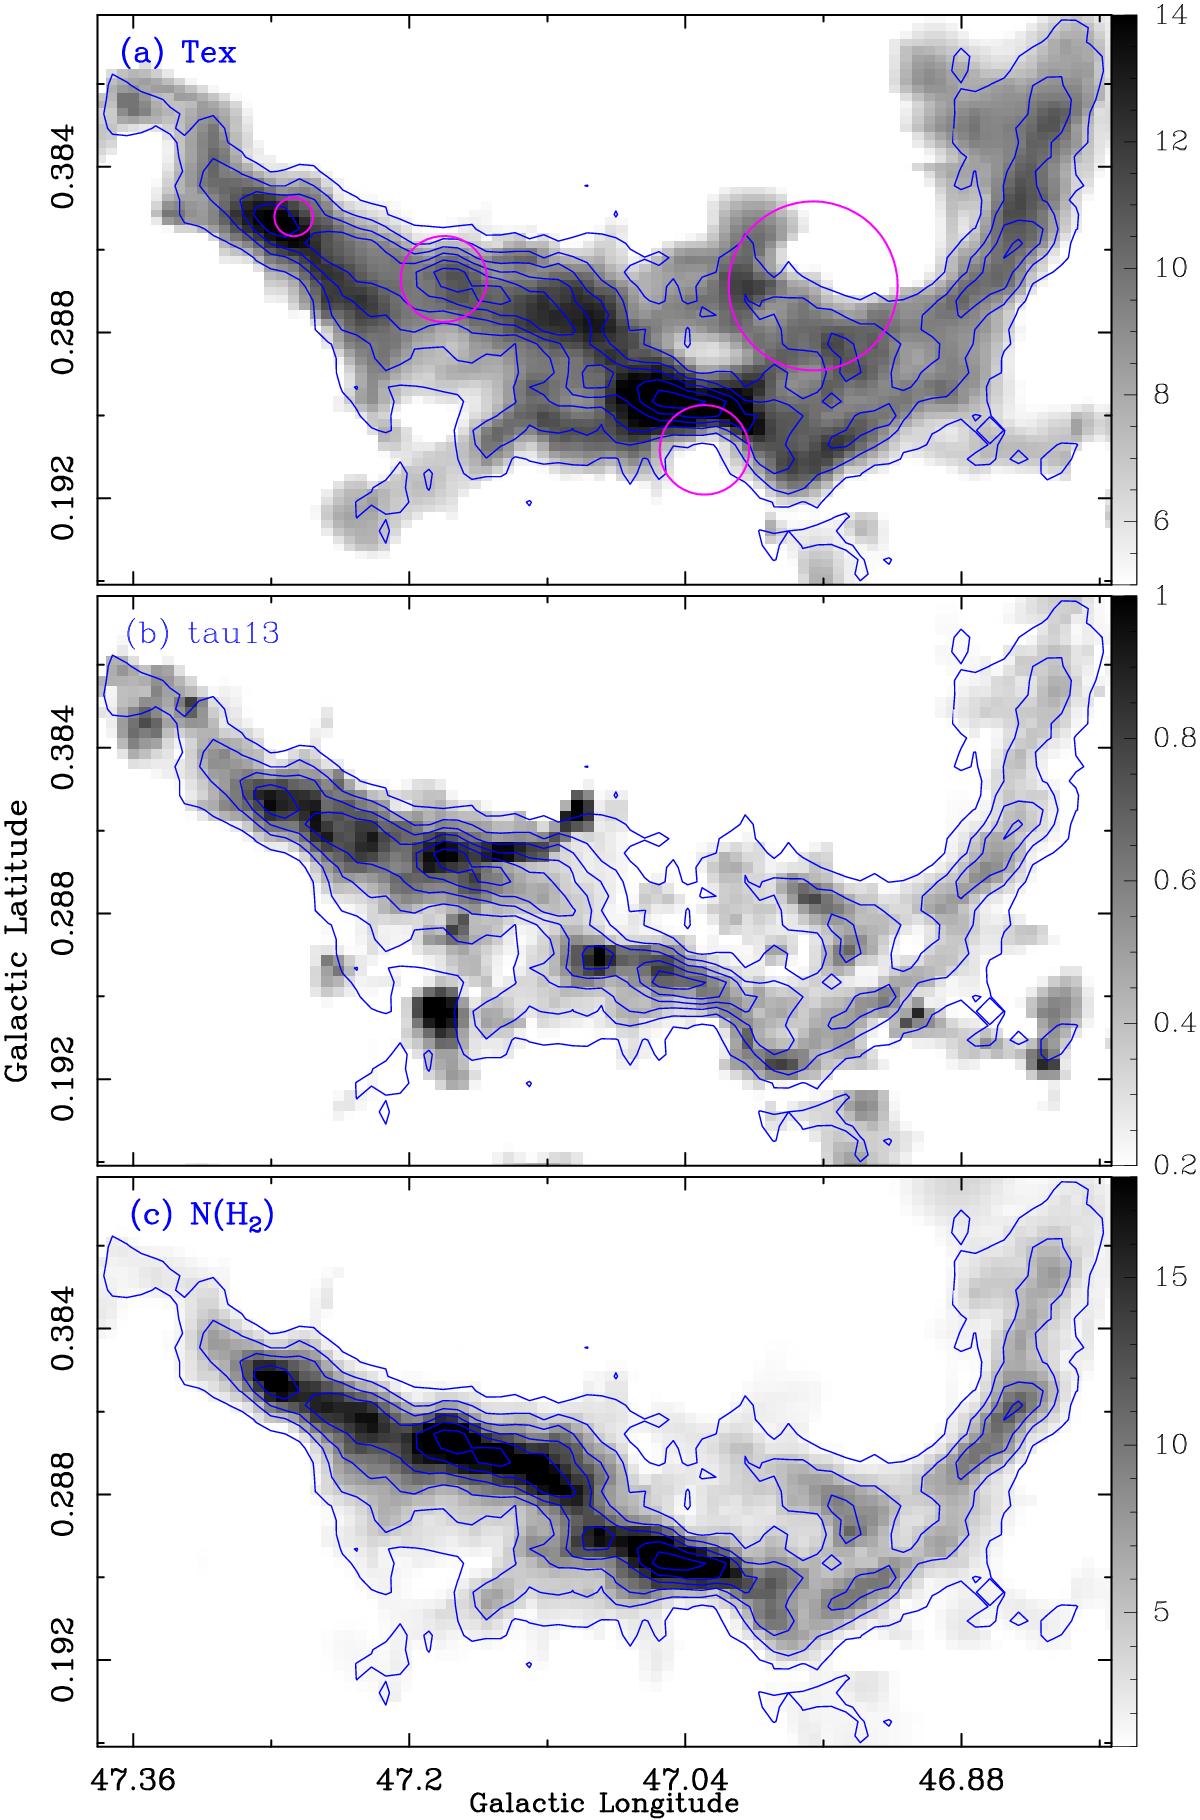
Panel a: map of the excitation temperature with a linear scale in units of K from the 12CO (J = 1−0) emission in the 52–64 km s-1 interval. Panel b: map of the optical depths of 13CO (J = 1−0). Panel c: map of the column density in units of 1021 cm-2. The blue contours represent the 13CO (J = 1−0) emission map.
Current usage metrics show cumulative count of Article Views (full-text article views including HTML views, PDF and ePub downloads, according to the available data) and Abstracts Views on Vision4Press platform.
Data correspond to usage on the plateform after 2015. The current usage metrics is available 48-96 hours after online publication and is updated daily on week days.
Initial download of the metrics may take a while.