Fig. 10
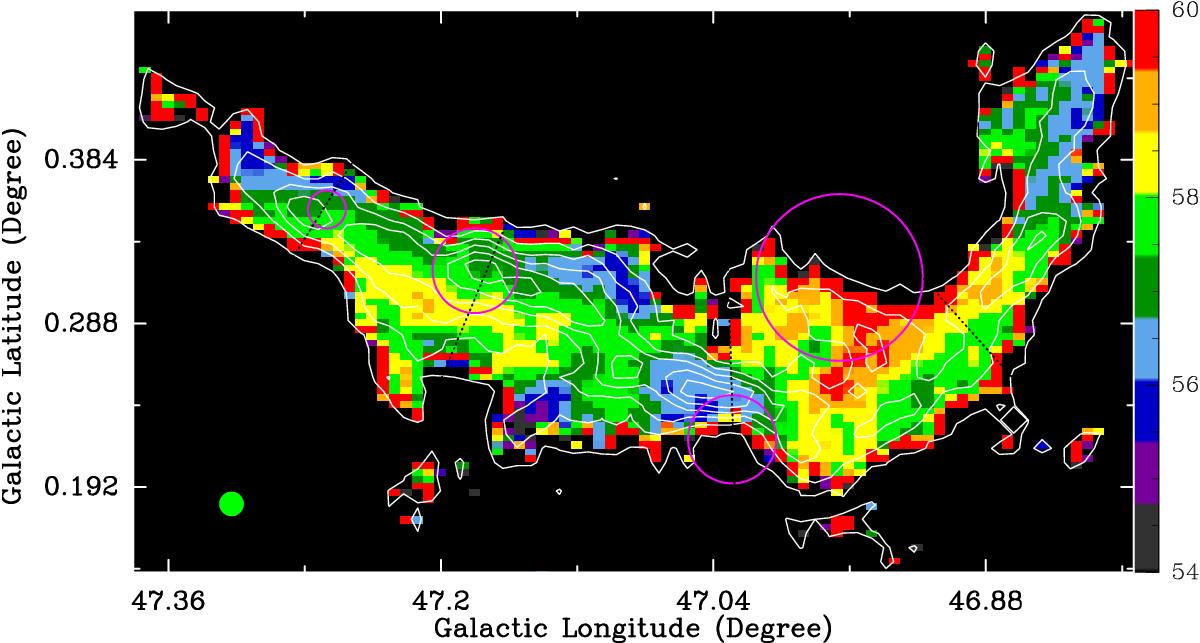
Velocity-field (moment 1) map of 13CO (J = 1−0) overlaid with its integrated intensity contours (white). The four pink circles represent the identified infrared bubbles. The beam size is shown in the lower-left corner. The right color bar is in units of km s-1. The four black dashed lines show the velocity gradients perpendicular to filament G47.06+0.26.
Current usage metrics show cumulative count of Article Views (full-text article views including HTML views, PDF and ePub downloads, according to the available data) and Abstracts Views on Vision4Press platform.
Data correspond to usage on the plateform after 2015. The current usage metrics is available 48-96 hours after online publication and is updated daily on week days.
Initial download of the metrics may take a while.