Fig. C.1
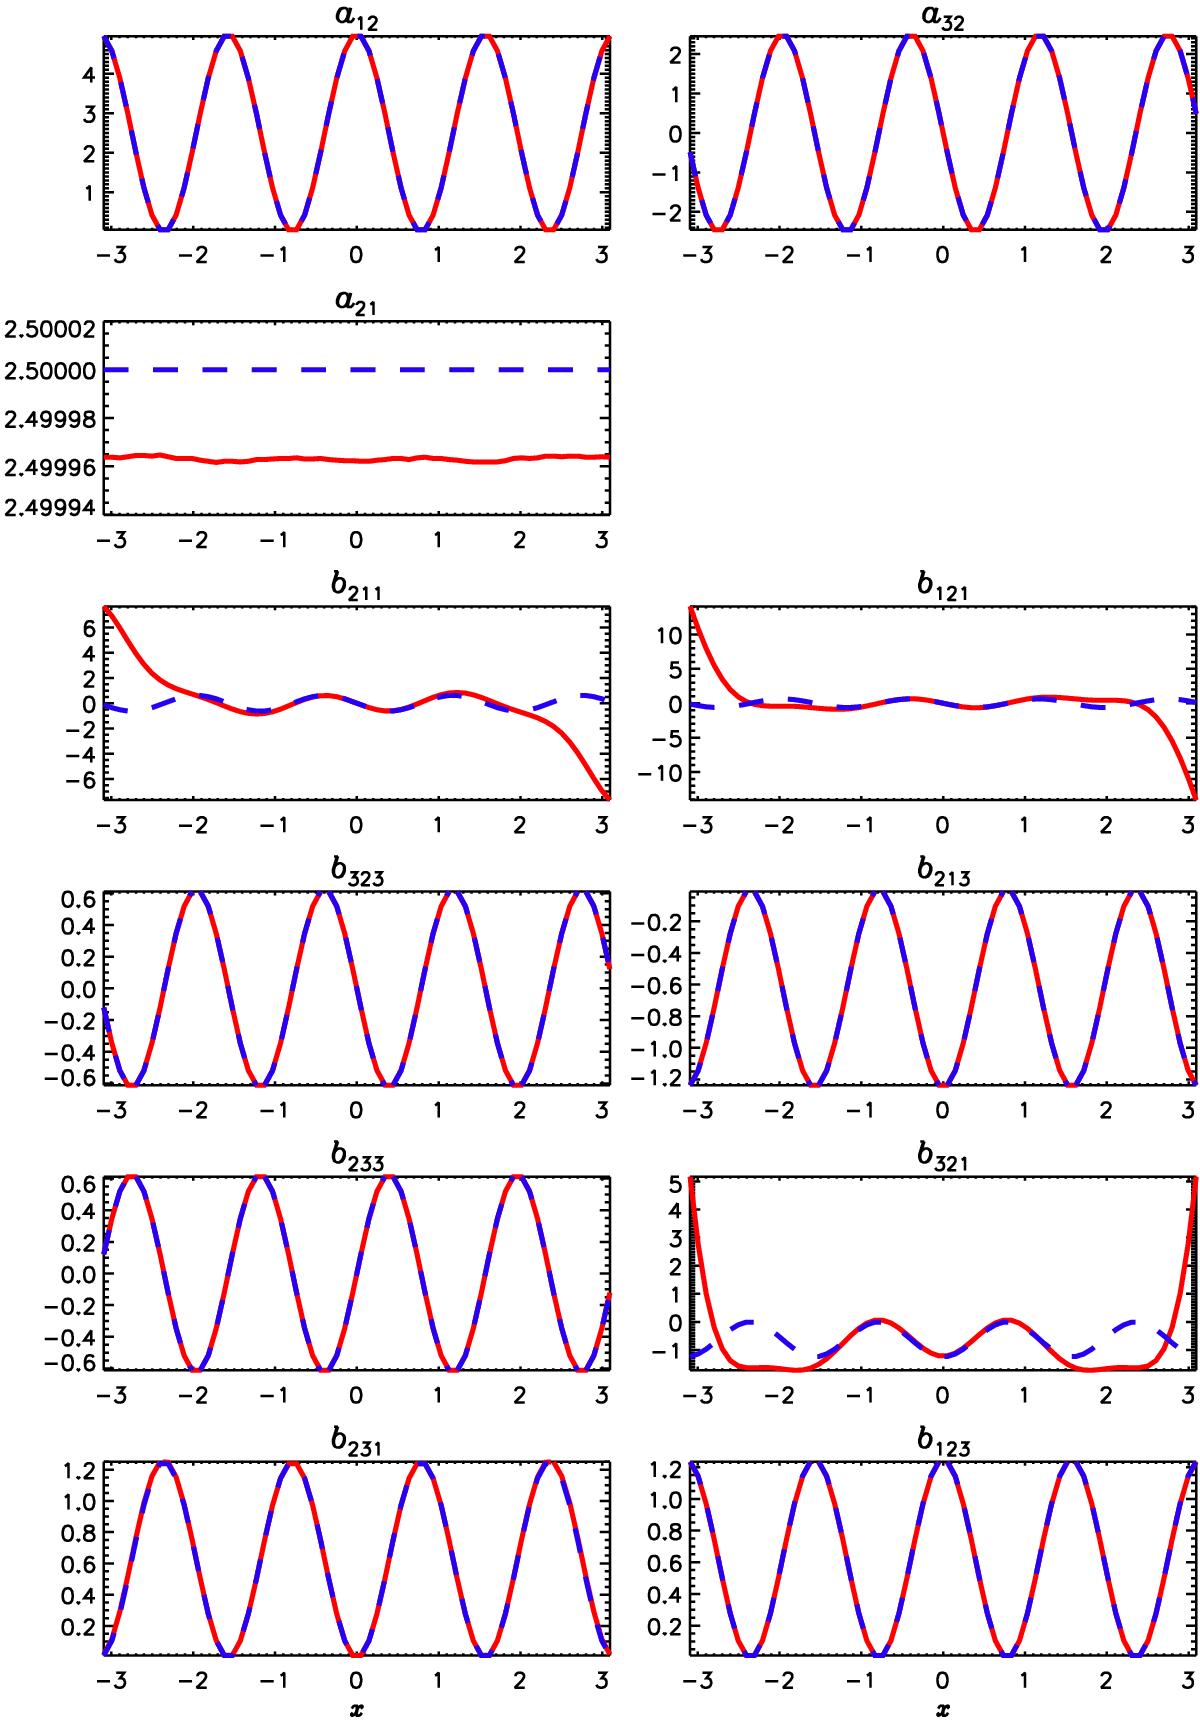
Comparison of analytical and test-field results for the flow Eq. (C.1) showing the mean-field coefficients as a function of x. Red solid: numerical, blue dashed: analytical. v0 = w0 = 1, k0 = 2, η = 0.05 in arbitrary units. The discrepancies in b211,b121, and b321 near the x boundaries are systematic errors due to the use of periodic boundary conditions for the solution of Eq. (5), which conflicts with the test fields, being linear in x and z.
Current usage metrics show cumulative count of Article Views (full-text article views including HTML views, PDF and ePub downloads, according to the available data) and Abstracts Views on Vision4Press platform.
Data correspond to usage on the plateform after 2015. The current usage metrics is available 48-96 hours after online publication and is updated daily on week days.
Initial download of the metrics may take a while.