Fig. A.1
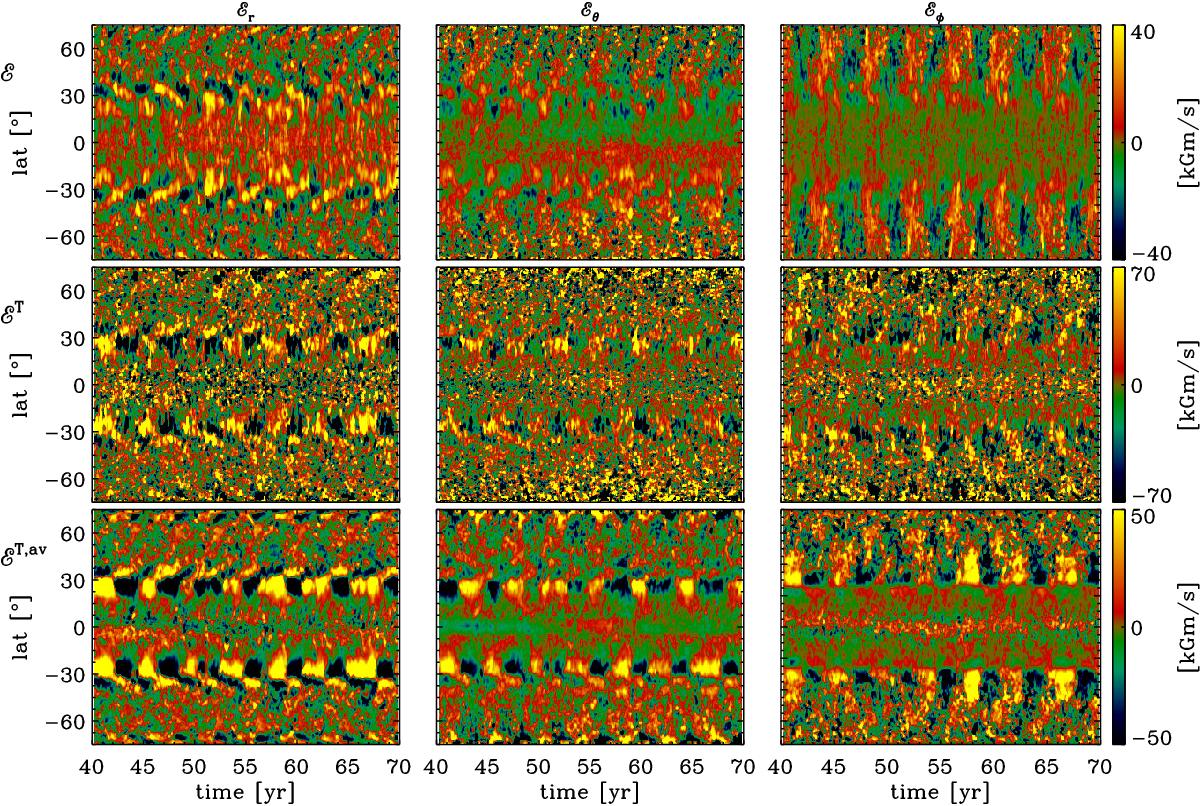
Comparison of all components of the original electromotive force ℰ (top row) with the reconstructed one, ![]() , in the middle of the convection zone, r = 0.85 R. Middle row: reconstruction with the time dependent transport coefficients,
, in the middle of the convection zone, r = 0.85 R. Middle row: reconstruction with the time dependent transport coefficients, ![]() . Bottom row: reconstruction with the time-averaged transport coefficients,
. Bottom row: reconstruction with the time-averaged transport coefficients, ![]() using Eq. (4). All data smoothed over 20 neighboring points in time.
using Eq. (4). All data smoothed over 20 neighboring points in time.
Current usage metrics show cumulative count of Article Views (full-text article views including HTML views, PDF and ePub downloads, according to the available data) and Abstracts Views on Vision4Press platform.
Data correspond to usage on the plateform after 2015. The current usage metrics is available 48-96 hours after online publication and is updated daily on week days.
Initial download of the metrics may take a while.