Fig. 12
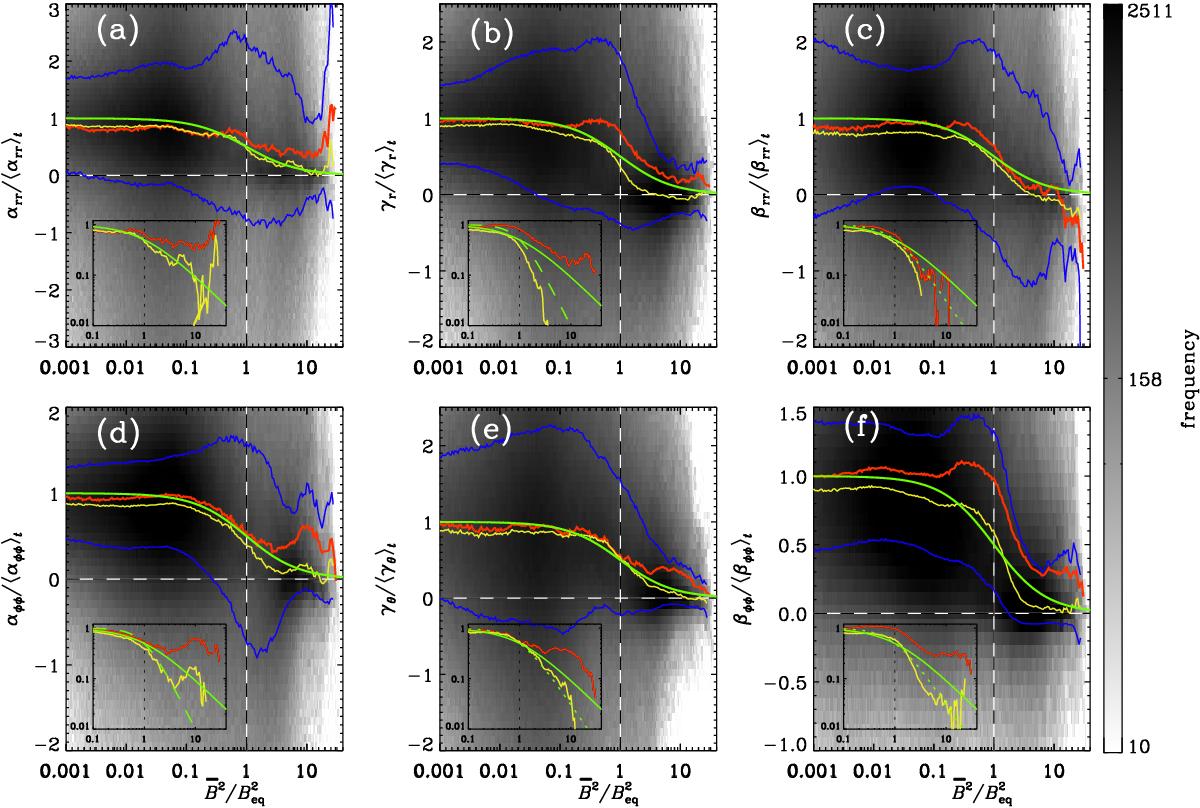
Quenching of transport coefficients shown as 2D histograms of αrr (a), γr (b), βrr (c), αφφ (d), γθ (e), βφφ (f), normalized by their time averages, over the normalized energy density of the mean field ![]() . Data are taken from the entire domain and the whole saturated stage. Red and yellow lines: mean and median, respectively; blue contours: margins of range, in which 50% of the values lay. Green line:
. Data are taken from the entire domain and the whole saturated stage. Red and yellow lines: mean and median, respectively; blue contours: margins of range, in which 50% of the values lay. Green line: ![]() . Inlays: average and median in log-log scale for zoomed-in range; dotted and dashed green:
. Inlays: average and median in log-log scale for zoomed-in range; dotted and dashed green: ![]() and
and ![]() , respectively.
, respectively.
Current usage metrics show cumulative count of Article Views (full-text article views including HTML views, PDF and ePub downloads, according to the available data) and Abstracts Views on Vision4Press platform.
Data correspond to usage on the plateform after 2015. The current usage metrics is available 48-96 hours after online publication and is updated daily on week days.
Initial download of the metrics may take a while.