Fig. 5
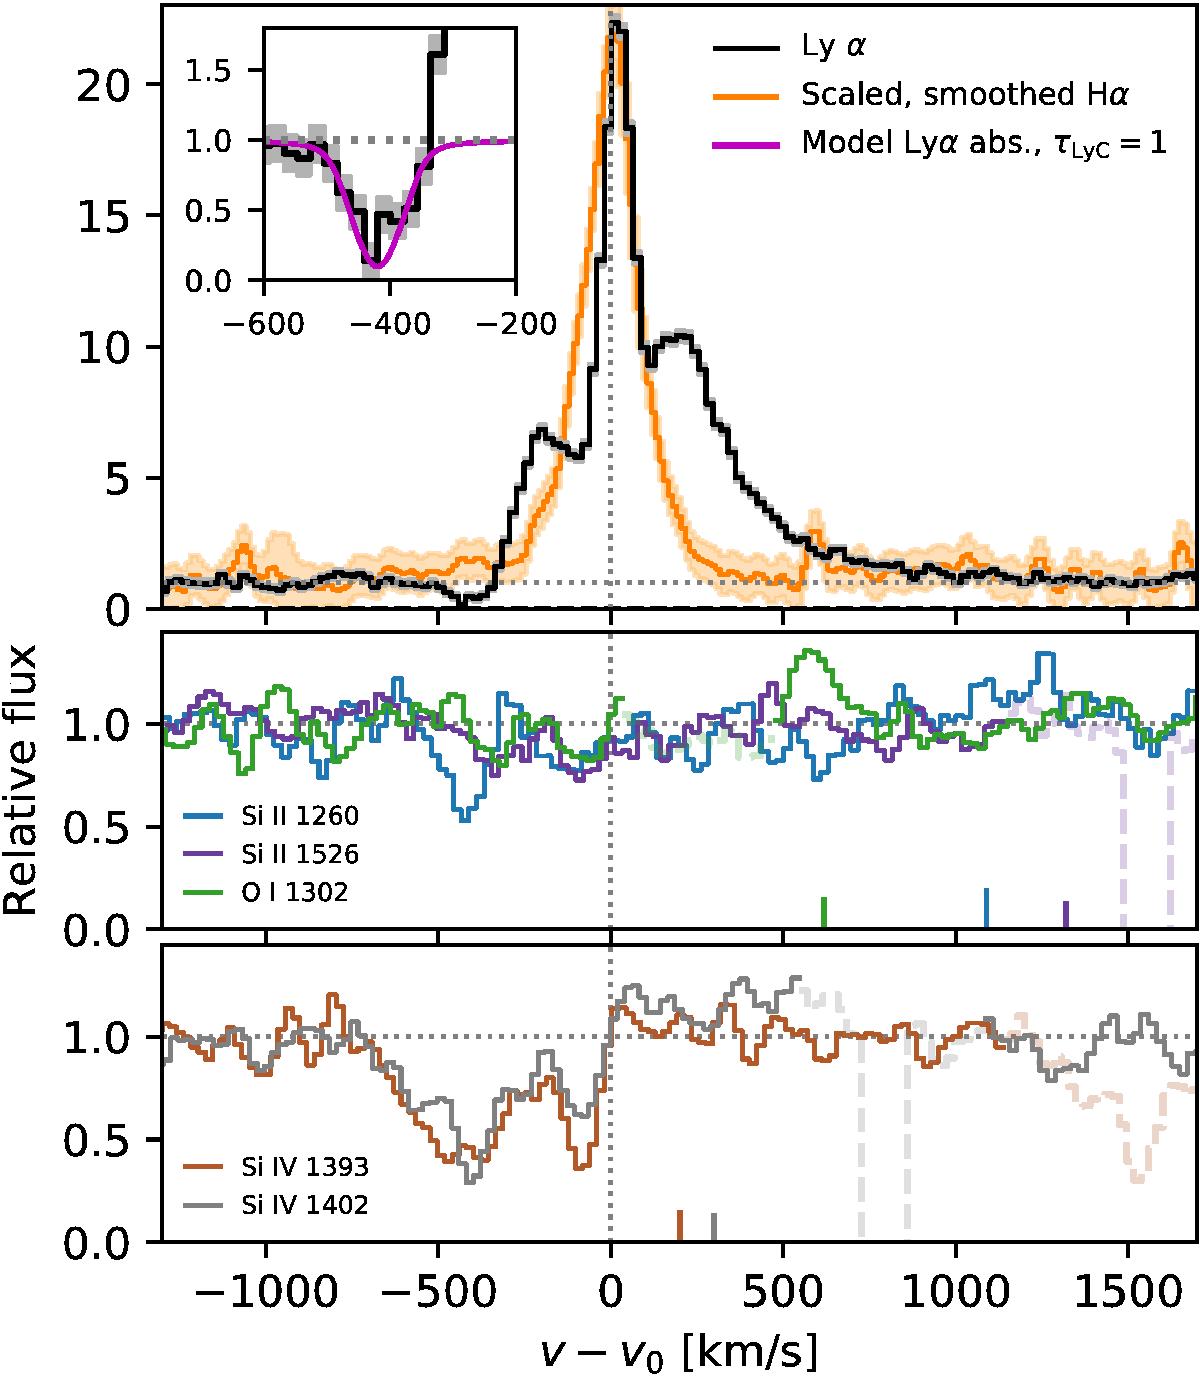
Continuum-normalized line profiles. Upper panel: Lyman α and smoothed, scaled Hα (see text for details). Inset: zoom-in on Lyα, with the theoretical absorption profile for τLyC = 1 superimposed. Middle panel: selected low-ionization metal absorption. Colored markers show the approximate expected position of fluorescent emission lines, color coded by their corresponding resonant line, with lengths indicating the average error spectrum in a velocity range of ± 1500 km s-1 around the line. Lower panel: Si iv. Colored markers show the average errors, but are placed at arbitrary wavelengths. Metal lines are smoothed by 3 px. Gray dotted lines denote continuum level (horizontal) and velocity zero point (vertical). Pale dashed lines show regions masked out due to contamination.
Current usage metrics show cumulative count of Article Views (full-text article views including HTML views, PDF and ePub downloads, according to the available data) and Abstracts Views on Vision4Press platform.
Data correspond to usage on the plateform after 2015. The current usage metrics is available 48-96 hours after online publication and is updated daily on week days.
Initial download of the metrics may take a while.