Fig. 3
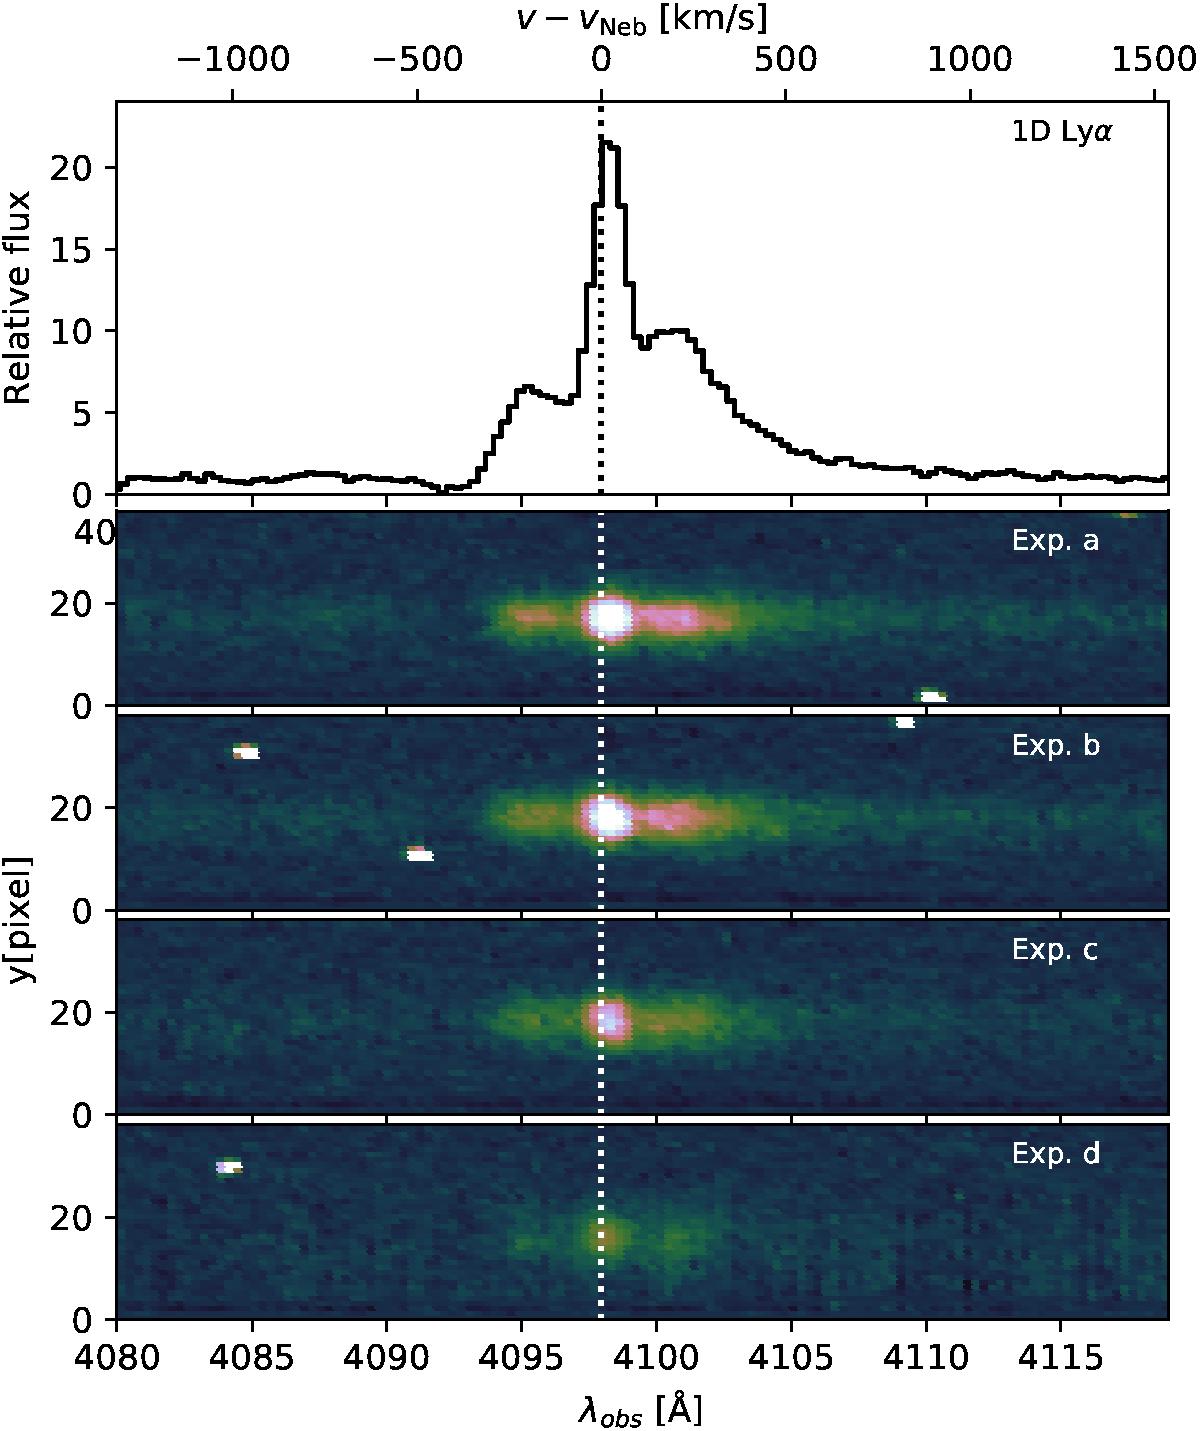
Top panel: observed Lyα in black. The error spectrum, not shown, is comparable to the line width. Lower panels: two-dimensional Lyα profiles of the four MagE exposures. The color scale is linear, and cut levels are set to enhance detail. The vertical dotted line indicates the best-fit velocity zero-point from rest frame optical nebular transitions.
Current usage metrics show cumulative count of Article Views (full-text article views including HTML views, PDF and ePub downloads, according to the available data) and Abstracts Views on Vision4Press platform.
Data correspond to usage on the plateform after 2015. The current usage metrics is available 48-96 hours after online publication and is updated daily on week days.
Initial download of the metrics may take a while.