Fig. 3
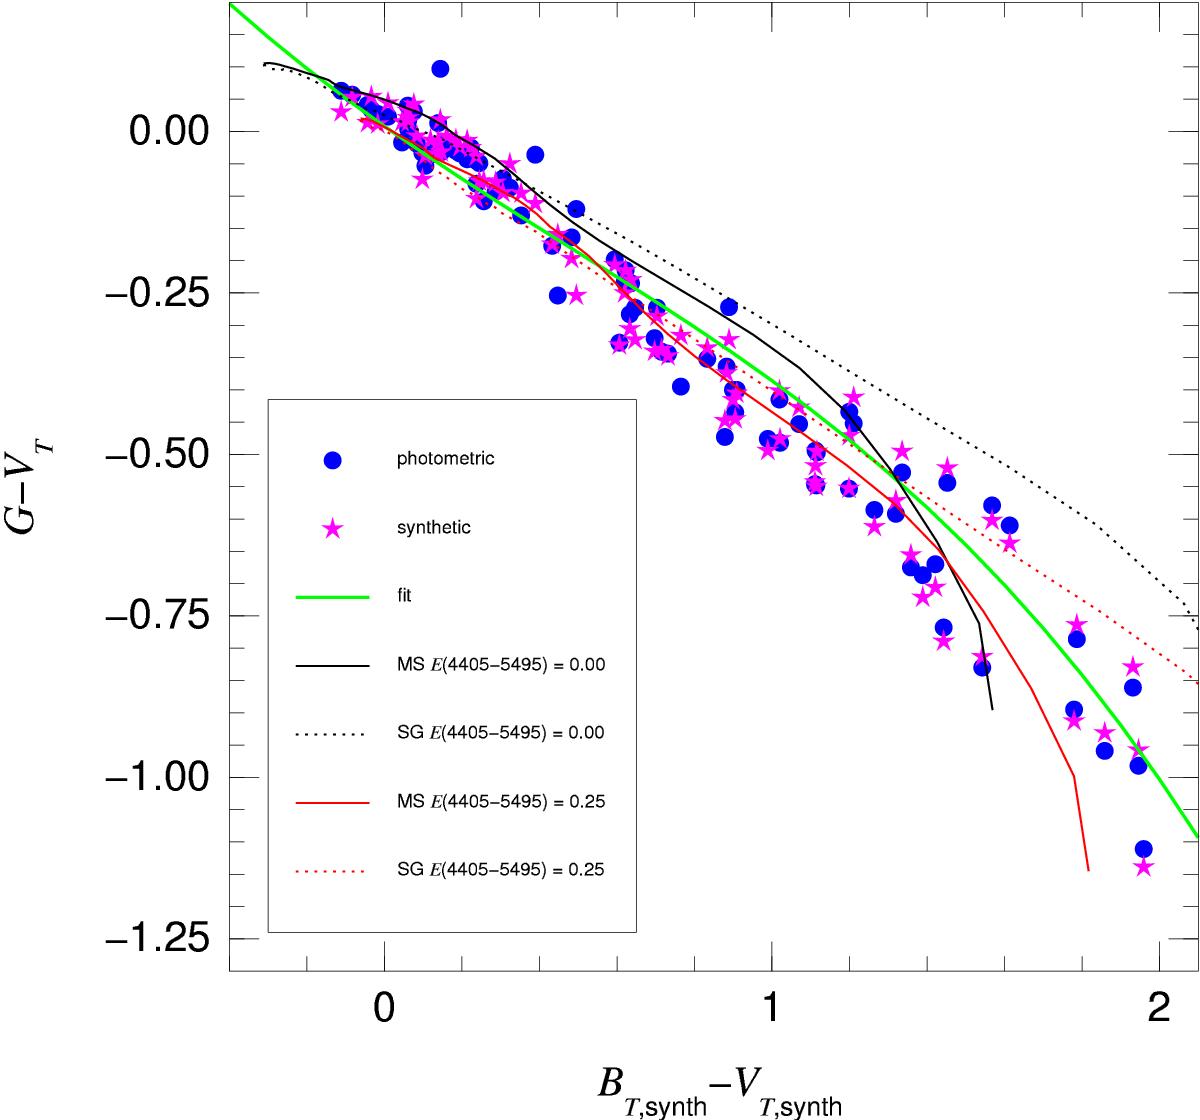
G−VT colors as a function of the synthetic BT−VT color. Both the observed (or photometric) and the synthetic (using the corrected G passband and the new zero point) values are shown for the vertical axis. The green line is the cubic polynomial fit of van Leeuwen et al. (2017). The other four lines show synthetic photometry for main sequence (MS) and supergiant (SG) solar-metallicity 4000−40 000 K models with no extinction and with E(4405−5495) = 0.25 and R5495 = 3.1 from Maíz Apellániz (2013) and Maíz Apellániz et al. (2014).
Current usage metrics show cumulative count of Article Views (full-text article views including HTML views, PDF and ePub downloads, according to the available data) and Abstracts Views on Vision4Press platform.
Data correspond to usage on the plateform after 2015. The current usage metrics is available 48-96 hours after online publication and is updated daily on week days.
Initial download of the metrics may take a while.