Fig. 2
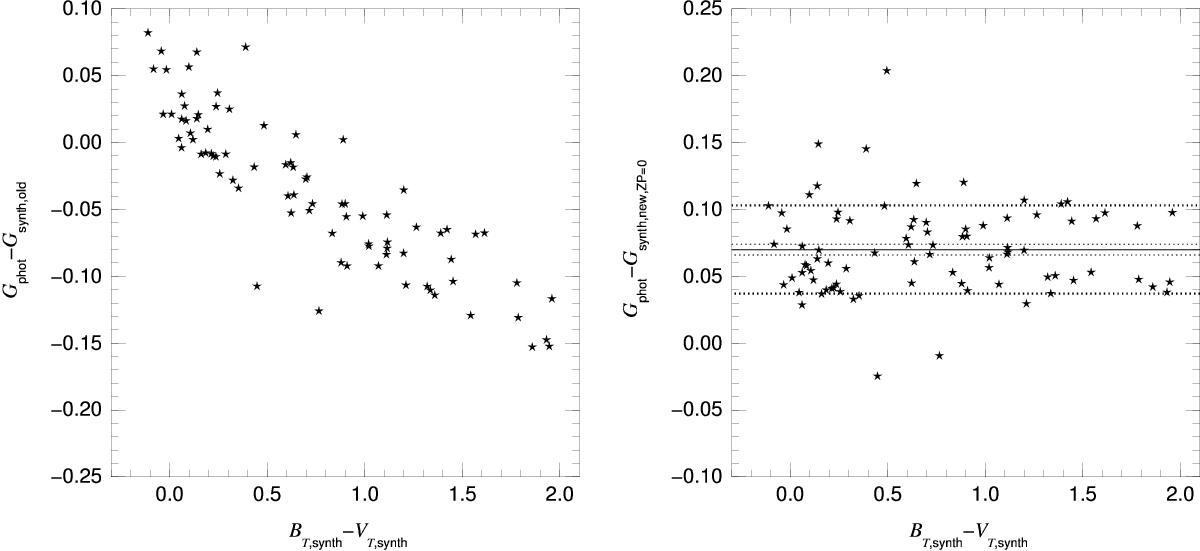
Difference between the photometric DR1 and the synthetic G magnitudes for the main NGSL+CALSPEC sample in this paper as a function of the synthetic BT−VT color. The left panel uses the nominal G passband curve and Vega zero point (0.030 mag) while the right panel uses the corrected G passband curve and a Vega zero point of 0. The horizontal lines in the right panel show the mean value (solid line, the new zero point) and the range spanned by the standard deviation of the data (thick dashed line, the typical uncertainty of an unsaturated star) and by the standard deviation of the mean (thin dashed line, the uncertainty of the zero point).
Current usage metrics show cumulative count of Article Views (full-text article views including HTML views, PDF and ePub downloads, according to the available data) and Abstracts Views on Vision4Press platform.
Data correspond to usage on the plateform after 2015. The current usage metrics is available 48-96 hours after online publication and is updated daily on week days.
Initial download of the metrics may take a while.