Fig. 3
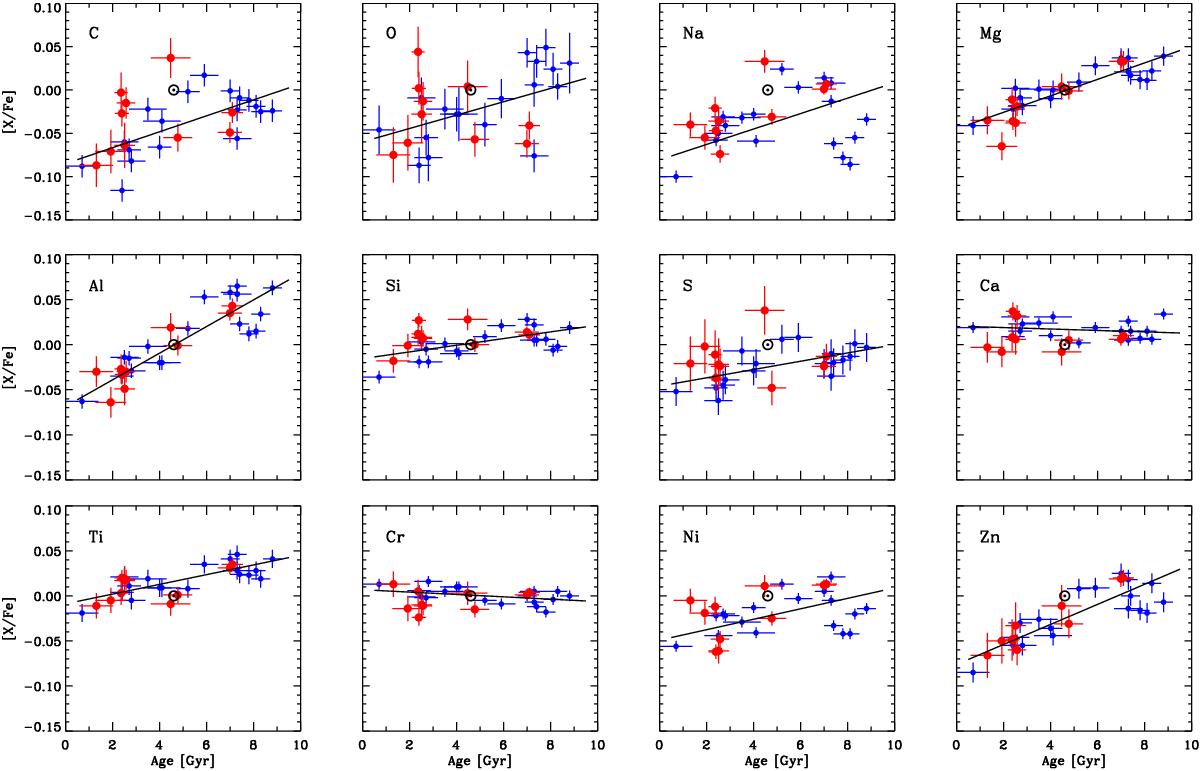
Abundance ratios [X/Fe] as a function of stellar age. Large (red) filled circles refer to Kepler LEGACY stars and small (blue) filled circles to solar twins from Nissen (2016). The lines show maximum likelihood linear fits to the data with errors in both coordinates taken into account. The Sun, shown with the ⊙ symbol, was not included in the fits. Zero points and slope coefficients for the fits are given in Table 3.
Current usage metrics show cumulative count of Article Views (full-text article views including HTML views, PDF and ePub downloads, according to the available data) and Abstracts Views on Vision4Press platform.
Data correspond to usage on the plateform after 2015. The current usage metrics is available 48-96 hours after online publication and is updated daily on week days.
Initial download of the metrics may take a while.