Fig. 6
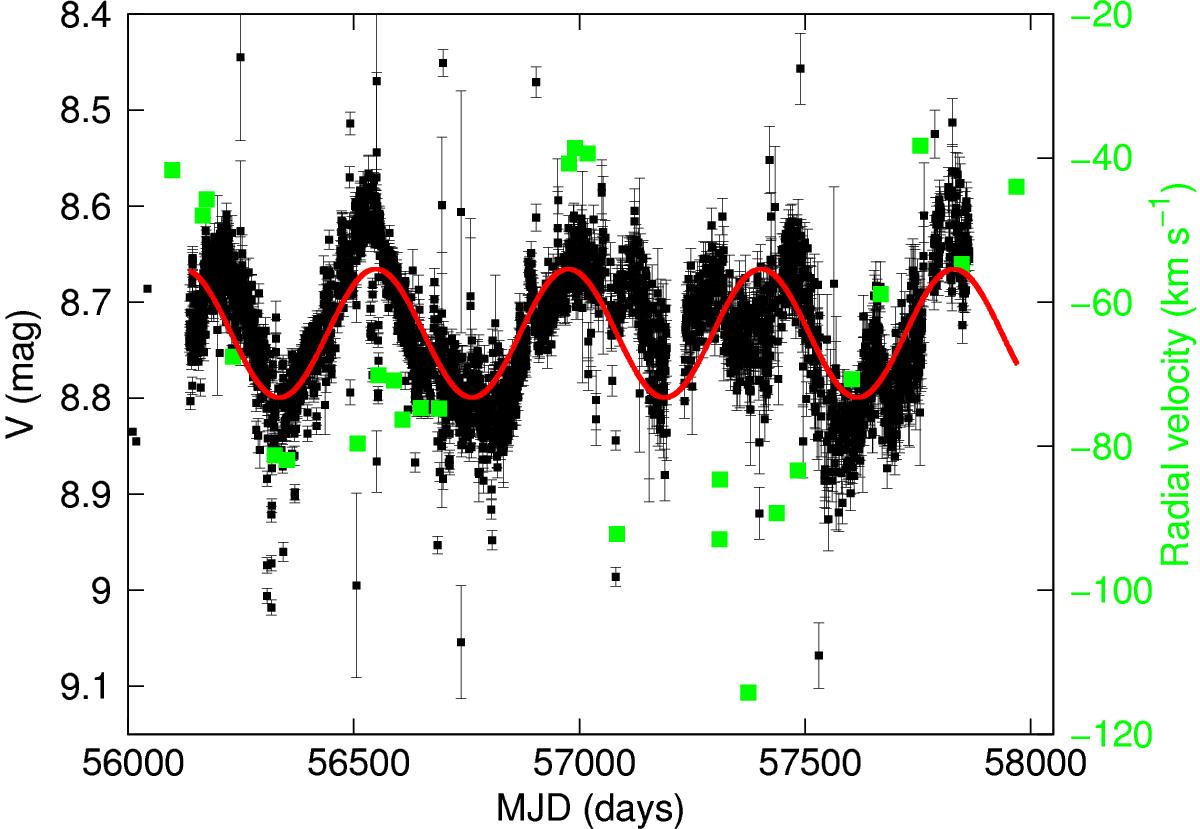
R71 V-band magnitude (black squares) and radial velocities of the blue wing with respect to the red wing of the double line profiles (green squares) are shown. A sinusoidal curve with a period of 425 d, corresponding to the peak in the periodogram, is superposed in red. The photometric cycle is half the length of the spectroscopic cycle with some chaotic behavior. This may hint at period doubling; see Sect. 4.2.
Current usage metrics show cumulative count of Article Views (full-text article views including HTML views, PDF and ePub downloads, according to the available data) and Abstracts Views on Vision4Press platform.
Data correspond to usage on the plateform after 2015. The current usage metrics is available 48-96 hours after online publication and is updated daily on week days.
Initial download of the metrics may take a while.