Fig. 4
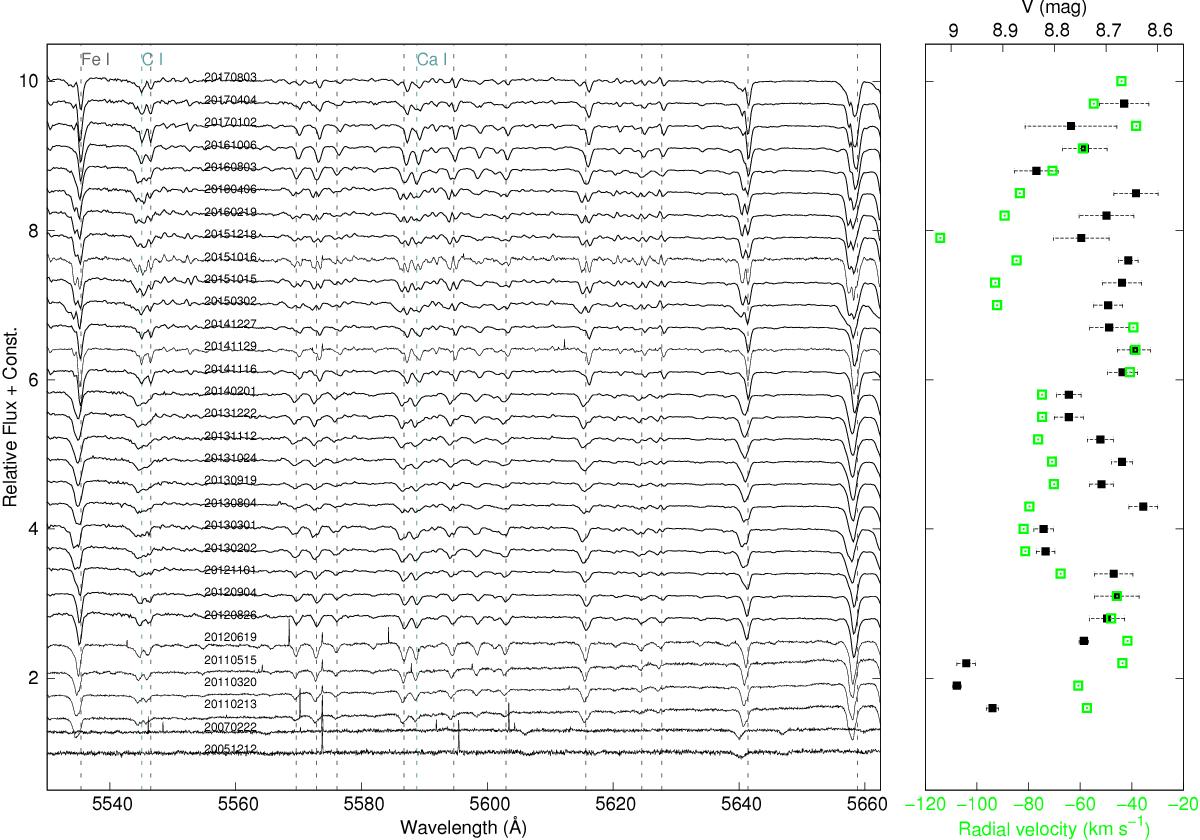
Left panel: absorption lines develop a second blue component with a cycle of about 850 d. Three cycles have been observed so far; see also Fig. 6. Gray dotted lines indicate Fe i lines. Right panel: V-band magnitude (black squares) at the time of the spectra to the left (average of ± 1 d around the time of the spectrum). The radial velocity of the blue wing with respect to the red wing of the line is shown (green squares); measurements were performed at the midpoint (between maximum and minimum depths of the lines).
Current usage metrics show cumulative count of Article Views (full-text article views including HTML views, PDF and ePub downloads, according to the available data) and Abstracts Views on Vision4Press platform.
Data correspond to usage on the plateform after 2015. The current usage metrics is available 48-96 hours after online publication and is updated daily on week days.
Initial download of the metrics may take a while.