Fig. 2
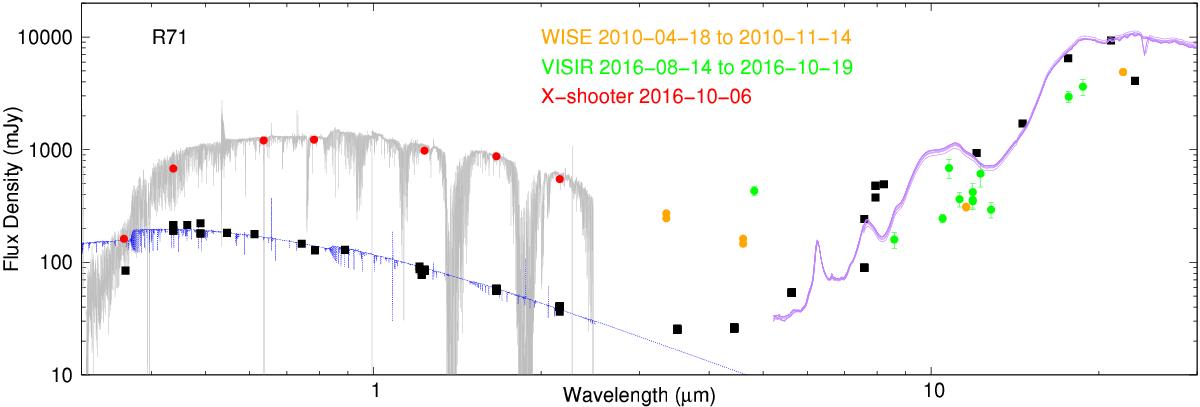
Near-ultraviolet to mid-infrared SED of R71. Literature values of the quiescent state of R71 are retrieved from VIZIER (black squares). The best-fit, reddened CMFGEN model for the quiescent state of R71 is shown (blue curve), as well as the October 2016 X-shooter spectrum during outburst (gray curve) and the synthetic U- to K-band photometry (red circles). The 2016 VISIR M- to Q2-band photometry (green circles) and 2010 WISE photometry (orange circles) complement the SED during the current LBV outburst of R71 to the mid-infrared. Comparison to Spitzer/IRS spectra in 2004–2005 suggests that the dust in the outermost regions has cooled down in the last decade (purple curve).
Current usage metrics show cumulative count of Article Views (full-text article views including HTML views, PDF and ePub downloads, according to the available data) and Abstracts Views on Vision4Press platform.
Data correspond to usage on the plateform after 2015. The current usage metrics is available 48-96 hours after online publication and is updated daily on week days.
Initial download of the metrics may take a while.