Fig. 11
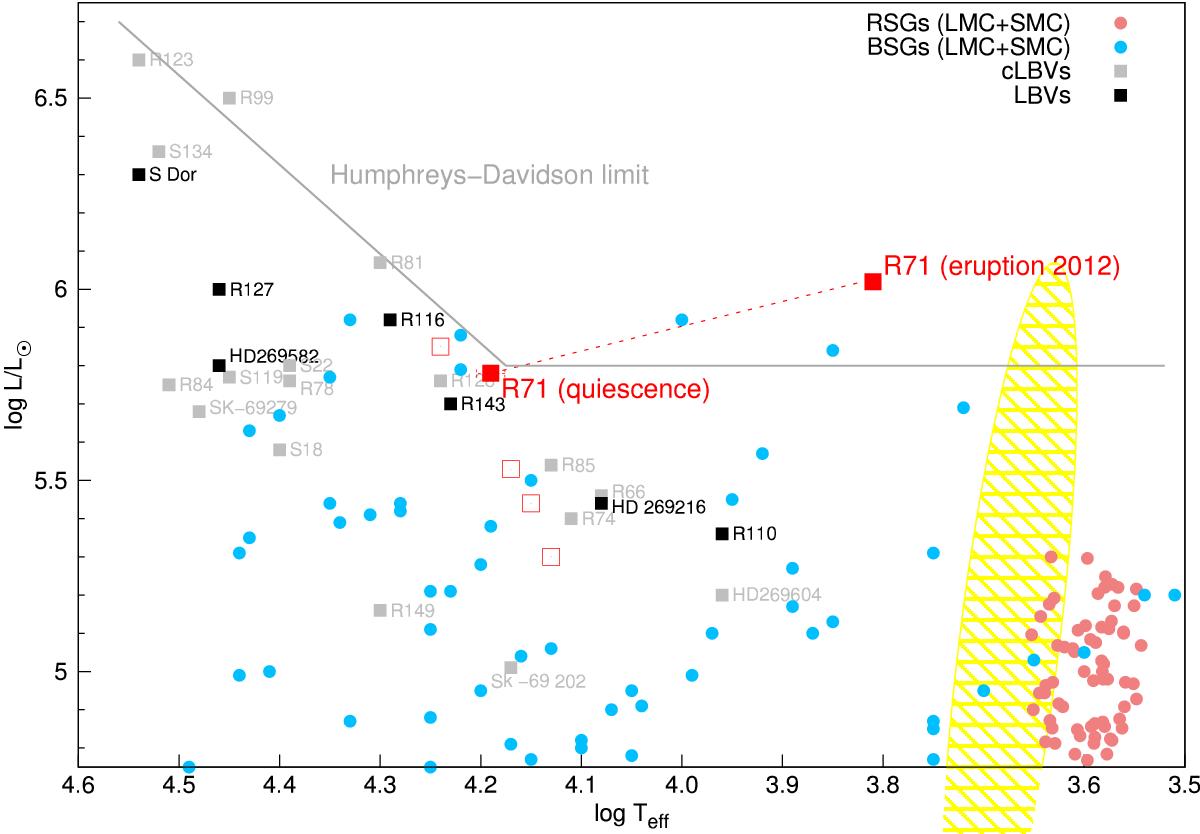
Schematic upper HR diagram of the LMC. The solid gray curve is the upper luminosity boundary for the LMC (Humphreys & Davidson 1979). Confirmed LBVs (black) and candidate LBVs (gray) are shown at their minimum phases (Zickgraf et al. 1986, 1996; van Genderen 2001; Tubbesing et al. 2002; Evans et al. 2004; Hainich et al. 2014). Blue and red supergiants are indicated with blue and red filled circles (Trundle et al. 2004; Trundle & Lennon 2005; Levesque et al. 2006; Hunter et al. 2008). We show the locations of R71 during its quiescent state and its current outburst (filled red squares, parameters from this paper, and Mehner et al. 2013). Whether R71 really increased its bolometric luminosity during the outburst as indicated in this figure requires more detailed modeling beyond the scope of this paper. Previous literature values of the quiescent state of R71 are also shown (open red squares). The dashed yellow ellipse indicates the extension of the Cepheid instability strip.
Current usage metrics show cumulative count of Article Views (full-text article views including HTML views, PDF and ePub downloads, according to the available data) and Abstracts Views on Vision4Press platform.
Data correspond to usage on the plateform after 2015. The current usage metrics is available 48-96 hours after online publication and is updated daily on week days.
Initial download of the metrics may take a while.