Fig. 1
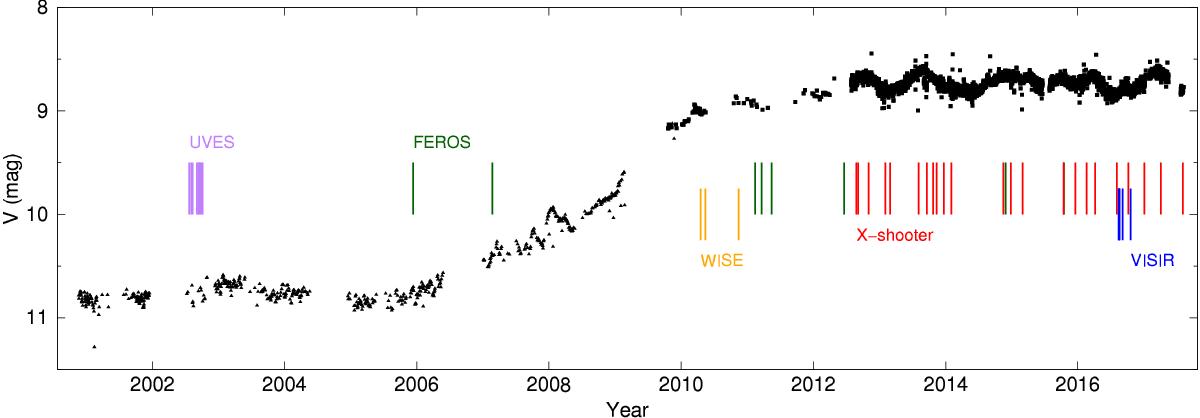
Visual light curve of R71 using data from ASAS (triangles; Pojmanski 1997) and AAVSO (squares; www.aavso.org). Epochs at which spectroscopic observations with UVES, FEROS, and X-shooter are available are indicated. The epochs of WISE and VISIR mid-infrared imaging observations are also indicated. An oscillation in the light curve is clearly apparent since 2010. Variations with a shorter timescale can be seen in 2007 and 2008 during the onset of the outburst.
Current usage metrics show cumulative count of Article Views (full-text article views including HTML views, PDF and ePub downloads, according to the available data) and Abstracts Views on Vision4Press platform.
Data correspond to usage on the plateform after 2015. The current usage metrics is available 48-96 hours after online publication and is updated daily on week days.
Initial download of the metrics may take a while.