Free Access
Fig. 7
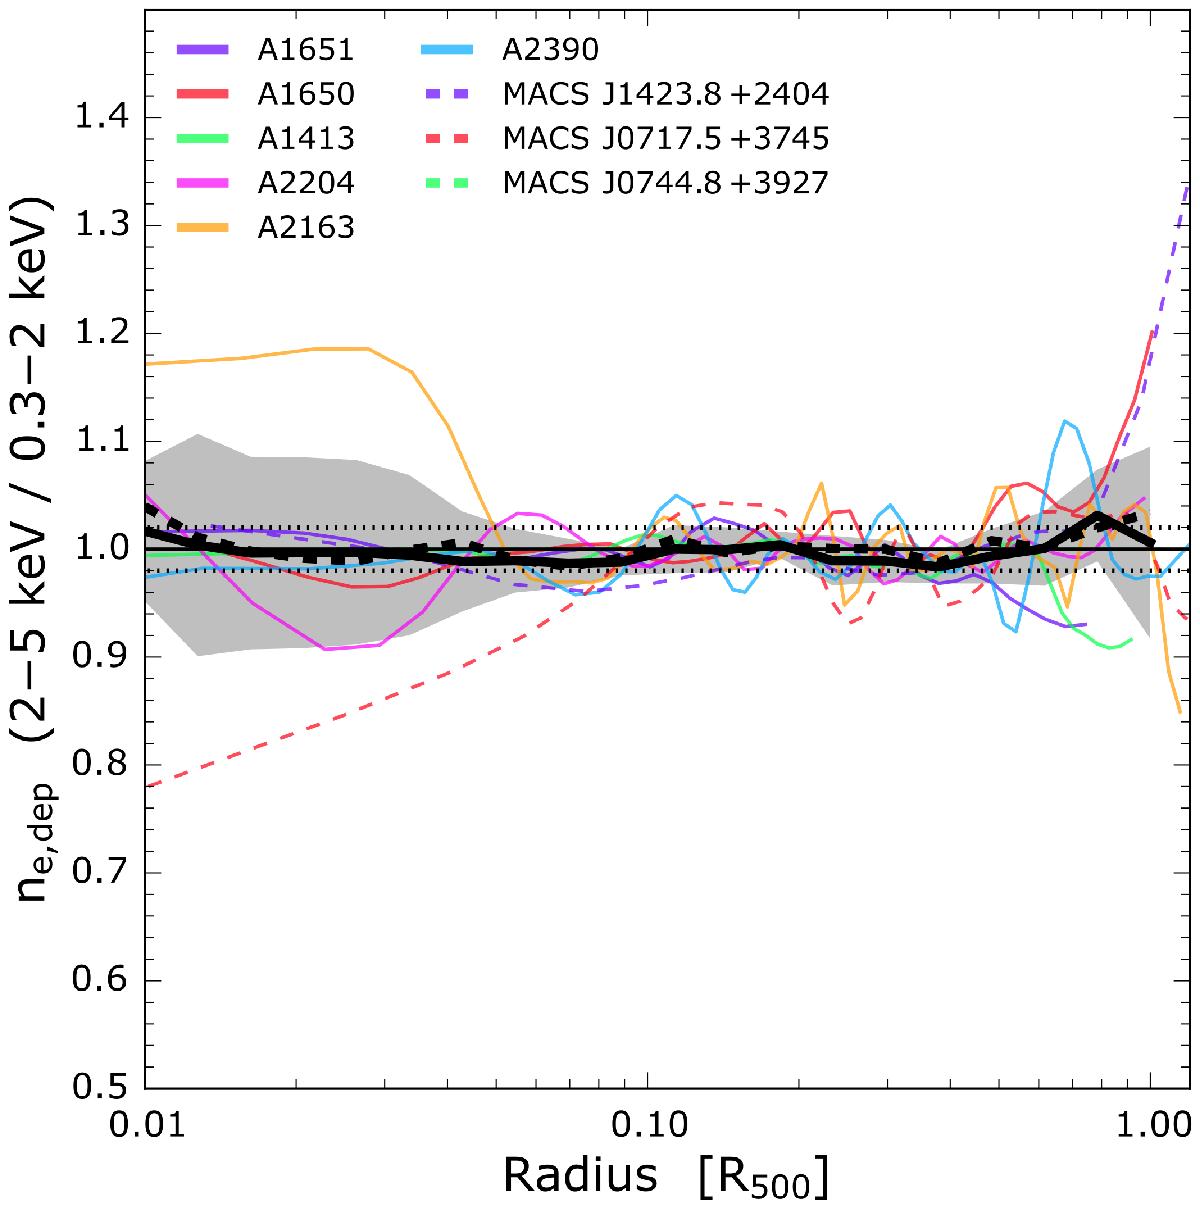
Test of the XMM-Newton PSF correction in the hard energy band. Comparison between the deprojected density profile obtained from the XMM-Newton surface brightness profiles extracted in the [0.3−2] keV and in the [2−5] keV band. Legend is the same as in Fig. 1 except that dotted lines represent ±2% level.
Current usage metrics show cumulative count of Article Views (full-text article views including HTML views, PDF and ePub downloads, according to the available data) and Abstracts Views on Vision4Press platform.
Data correspond to usage on the plateform after 2015. The current usage metrics is available 48-96 hours after online publication and is updated daily on week days.
Initial download of the metrics may take a while.