Fig. 6
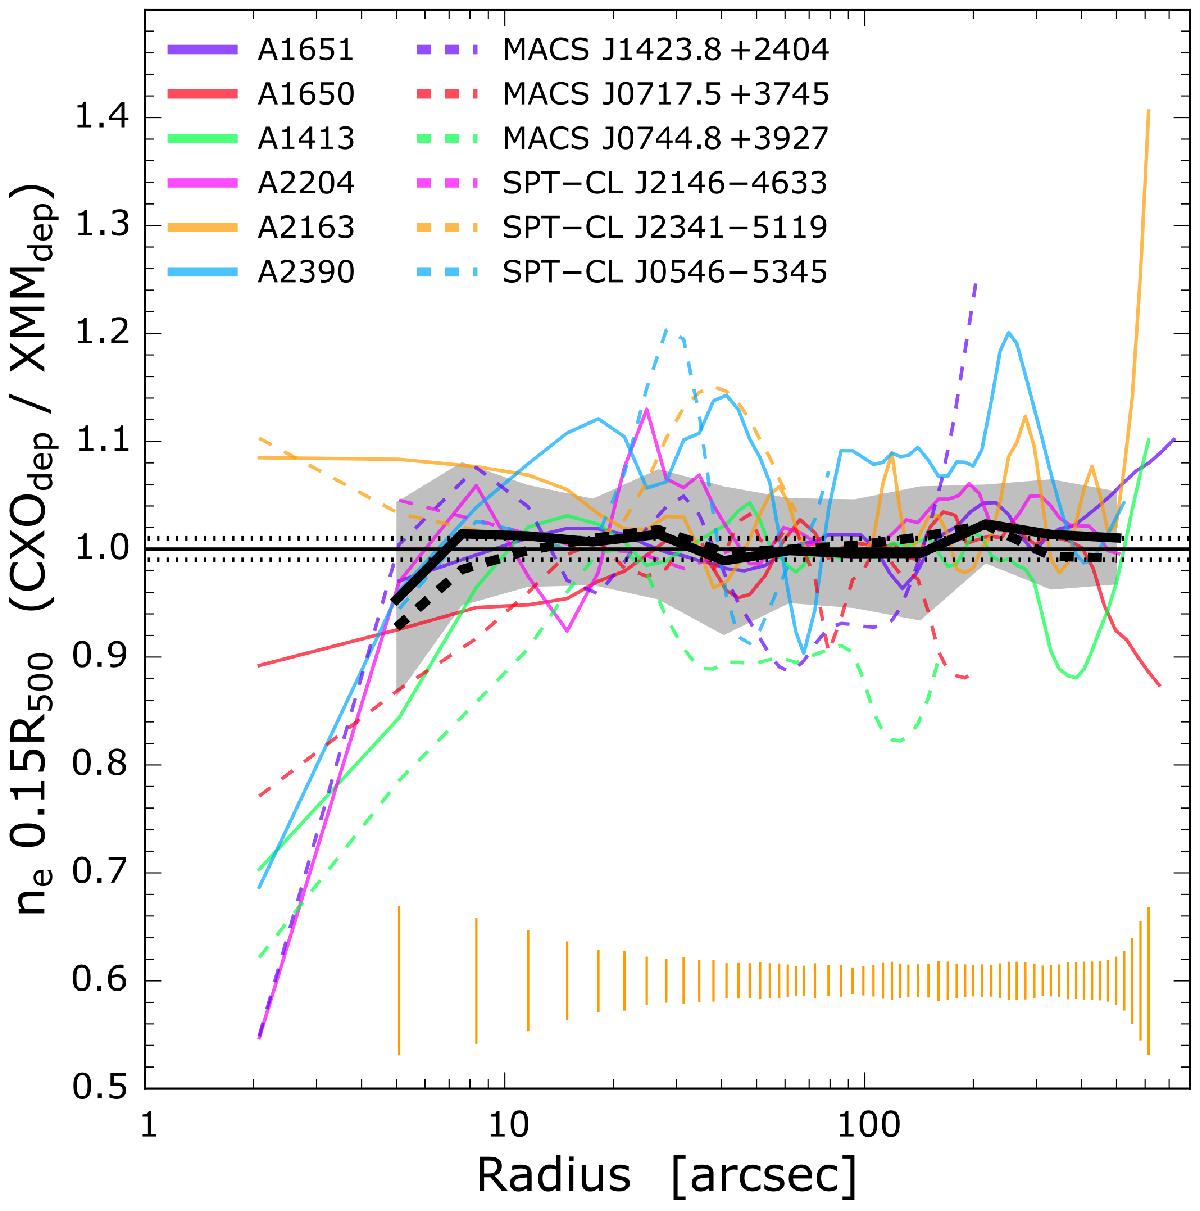
Test of the XMM-Newton PSF correction in the soft energy band: ratio between normalised density profiles obtained from the deprojection of Chandra and XMM-Newton surface brightness profiles. The error bars correspond to the error on the A2163 profile, and represent the typical uncertainties as a function of radius. Each profile is normalised by the density computed at R = 0.15 R500 to assess shape differences. There is an excellent agreement between the profile shape above 5″, showing that the XMM-Newton PSF is properly accounted for in the density reconstruction. Legend as in Fig. 1 except that horizontal dotted lines represent ± 1% levels.
Current usage metrics show cumulative count of Article Views (full-text article views including HTML views, PDF and ePub downloads, according to the available data) and Abstracts Views on Vision4Press platform.
Data correspond to usage on the plateform after 2015. The current usage metrics is available 48-96 hours after online publication and is updated daily on week days.
Initial download of the metrics may take a while.