Fig. 4
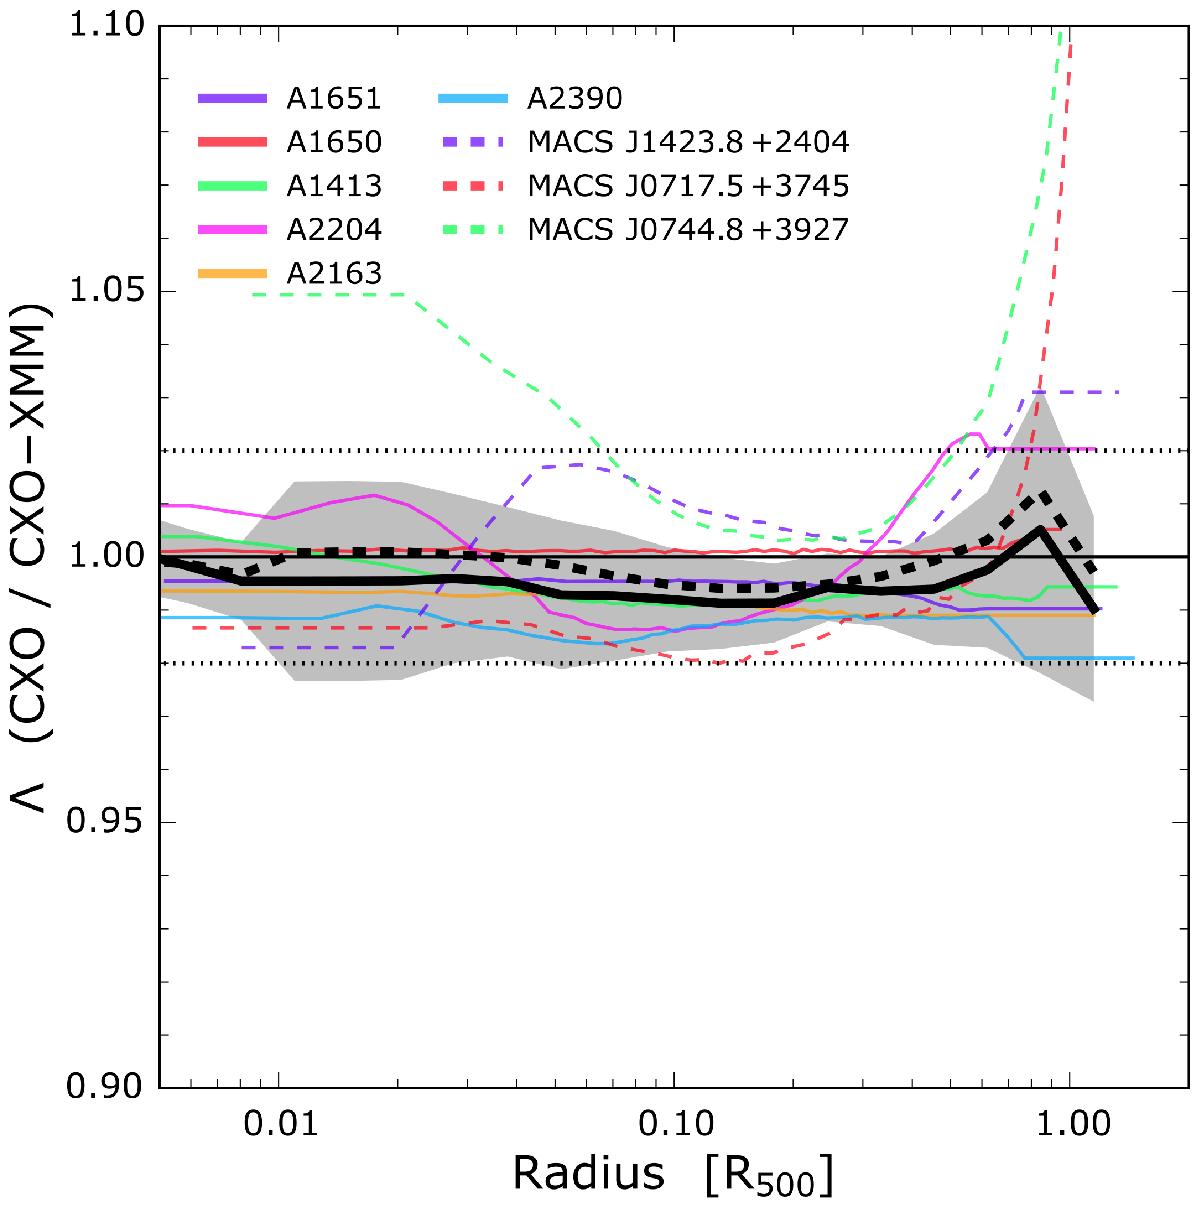
Effect of systematics on temperature profiles. Ratio of Λ(T) profiles derived for Chandra data, using the temperature profiles measured by Chandra and XMM-Newton. The z> 0.9 clusters are excluded as the Chandra observations are not sufficiently deep for temperature profiles to be measured. The legend is the same as in Fig. 1 except that horizontal dotted lines represent ± 2% levels.
Current usage metrics show cumulative count of Article Views (full-text article views including HTML views, PDF and ePub downloads, according to the available data) and Abstracts Views on Vision4Press platform.
Data correspond to usage on the plateform after 2015. The current usage metrics is available 48-96 hours after online publication and is updated daily on week days.
Initial download of the metrics may take a while.