Fig. 3
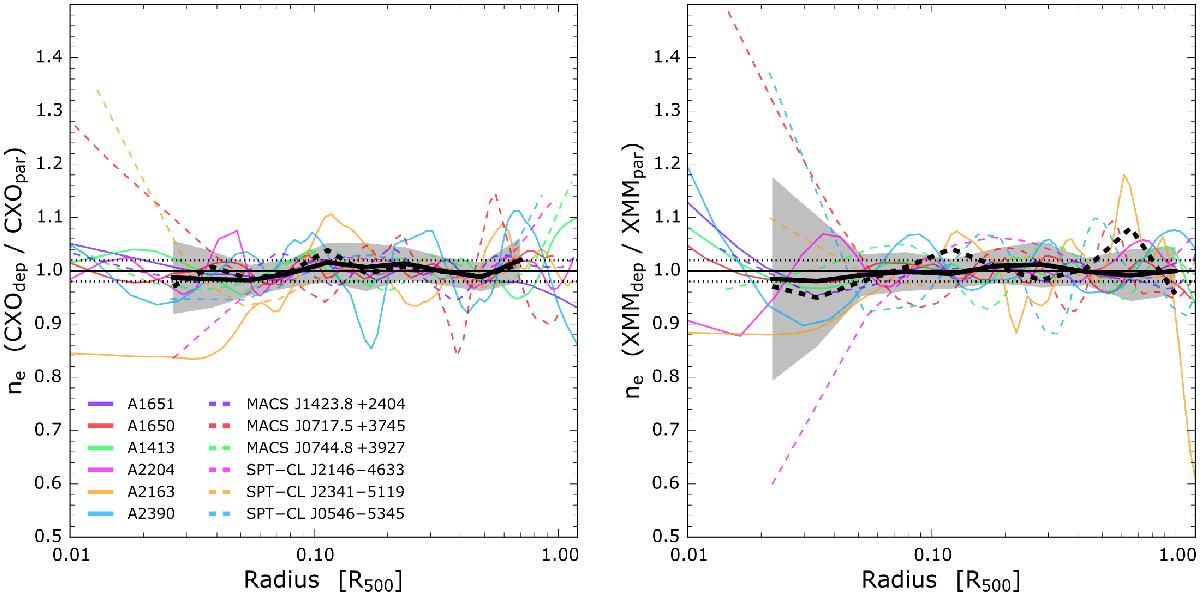
Test of parametric vs. deprojection methods. Left panel: ratio between the Chandra density profiles obtained using the deprojection and parametric fit techniques. All other aspects of the analysis are identical. Legend as in Fig. 1 except that the dotted lines represent ± 2% levels here. Right panel: same as in the left panel, but for the XMM-Newton density profiles.
Current usage metrics show cumulative count of Article Views (full-text article views including HTML views, PDF and ePub downloads, according to the available data) and Abstracts Views on Vision4Press platform.
Data correspond to usage on the plateform after 2015. The current usage metrics is available 48-96 hours after online publication and is updated daily on week days.
Initial download of the metrics may take a while.