Fig. 2
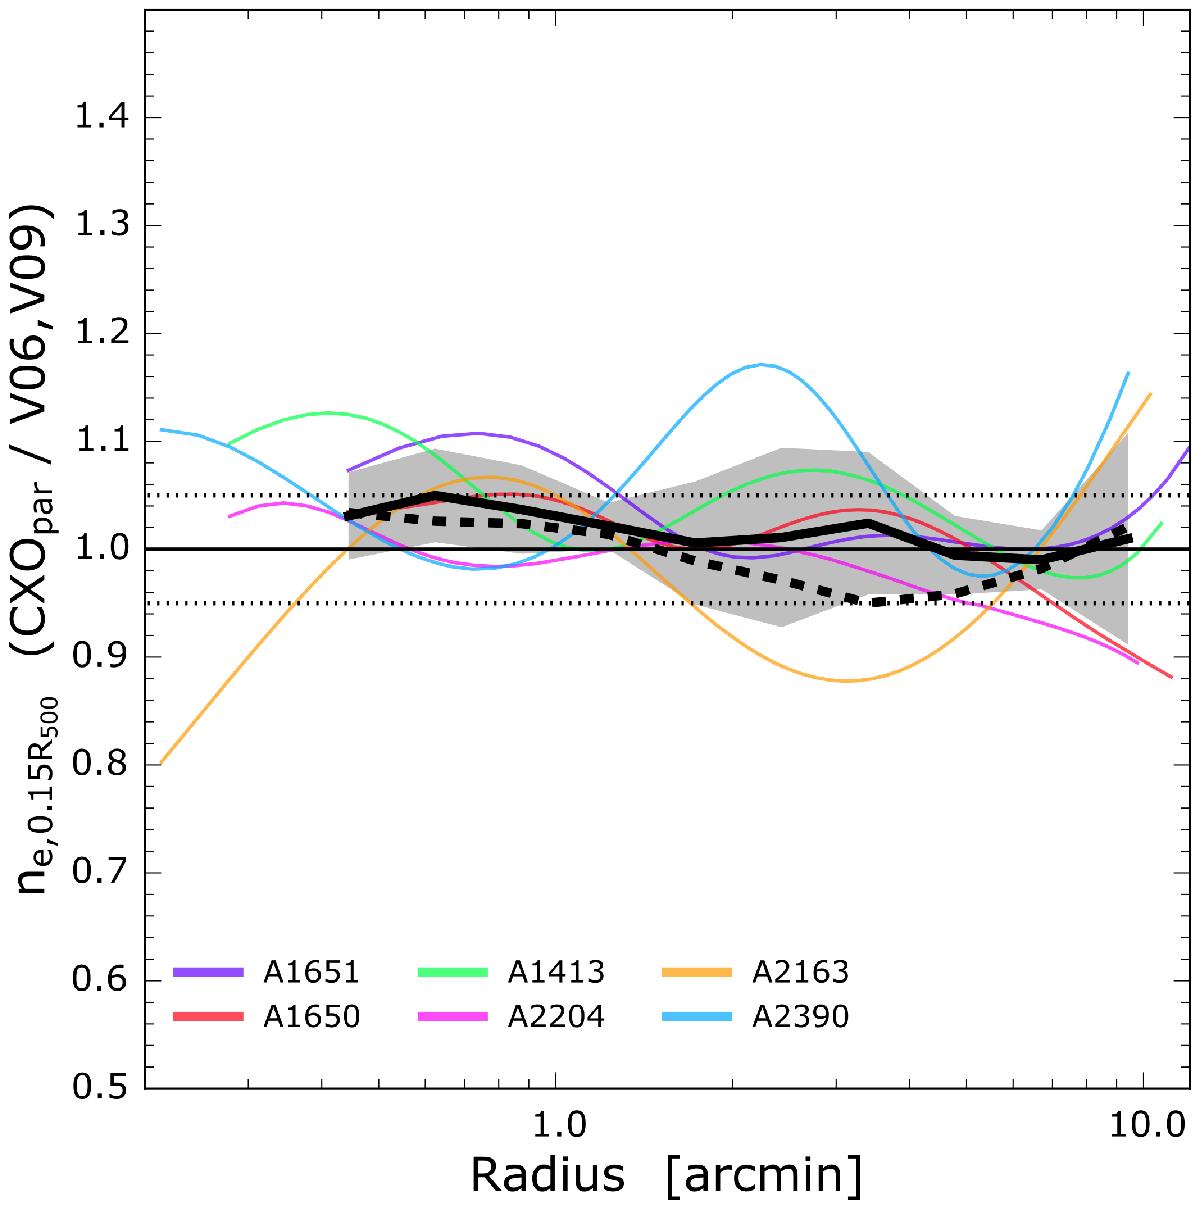
Test of the Chandra photon weighting implementation developed in the present paper (Sect. 3.1 and Appendix B). The Figure shows the ratio between the parametric Chandra density profiles derived with the weighting method developed here (pre-correction) and those published in V06/V09 (post-correction). Profiles are scaled by ne,0.15 R500 to compare the shape. Legend as for Fig. 1. Also as for Fig. 1, deviations in the core (r< 0.5′) are due to the different centres used for profile extraction.
Current usage metrics show cumulative count of Article Views (full-text article views including HTML views, PDF and ePub downloads, according to the available data) and Abstracts Views on Vision4Press platform.
Data correspond to usage on the plateform after 2015. The current usage metrics is available 48-96 hours after online publication and is updated daily on week days.
Initial download of the metrics may take a while.