Fig. C.1
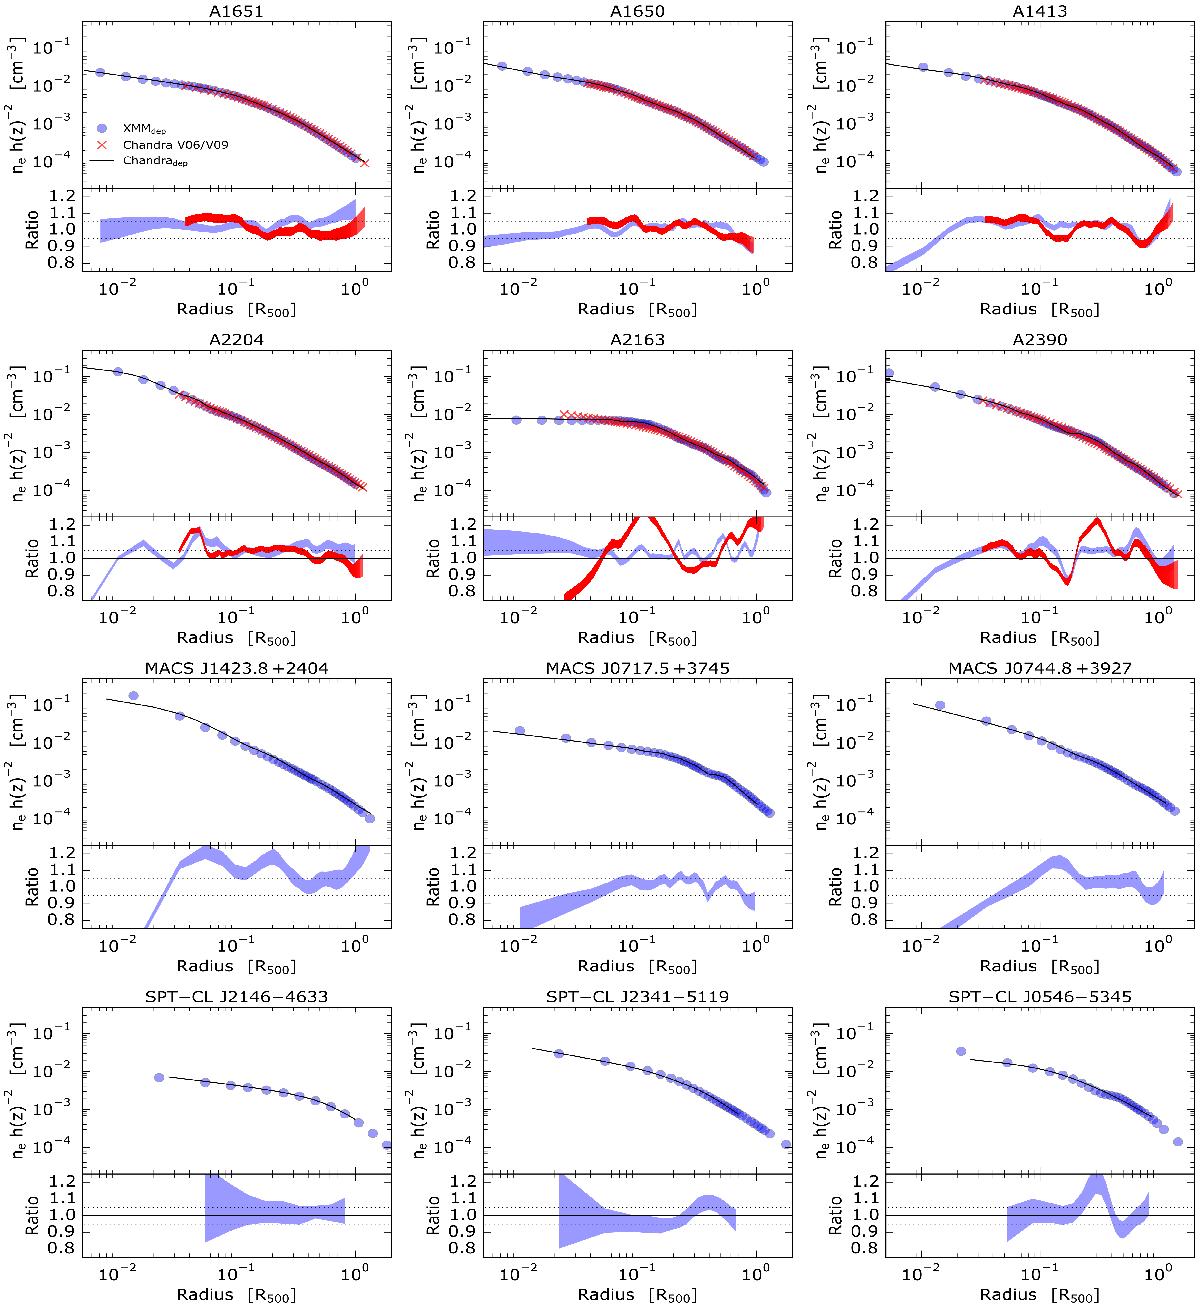
For each panel, top: deprojected scaled density profile obtained using Chandra and XMM-Newton plotted using black solid line and blue points, respectively. We also show the parametric density profiles published in V06 with red crosses. For each panel, bottom: ratio between the Chandra and the XMM-Newton density profiles and between our Chandra and V06/V09 samples using blue and red shaded areas, respectively. The solid line and the dotted lines represent the unity and the ± 5% levels, respectively.
Current usage metrics show cumulative count of Article Views (full-text article views including HTML views, PDF and ePub downloads, according to the available data) and Abstracts Views on Vision4Press platform.
Data correspond to usage on the plateform after 2015. The current usage metrics is available 48-96 hours after online publication and is updated daily on week days.
Initial download of the metrics may take a while.