Fig. 1
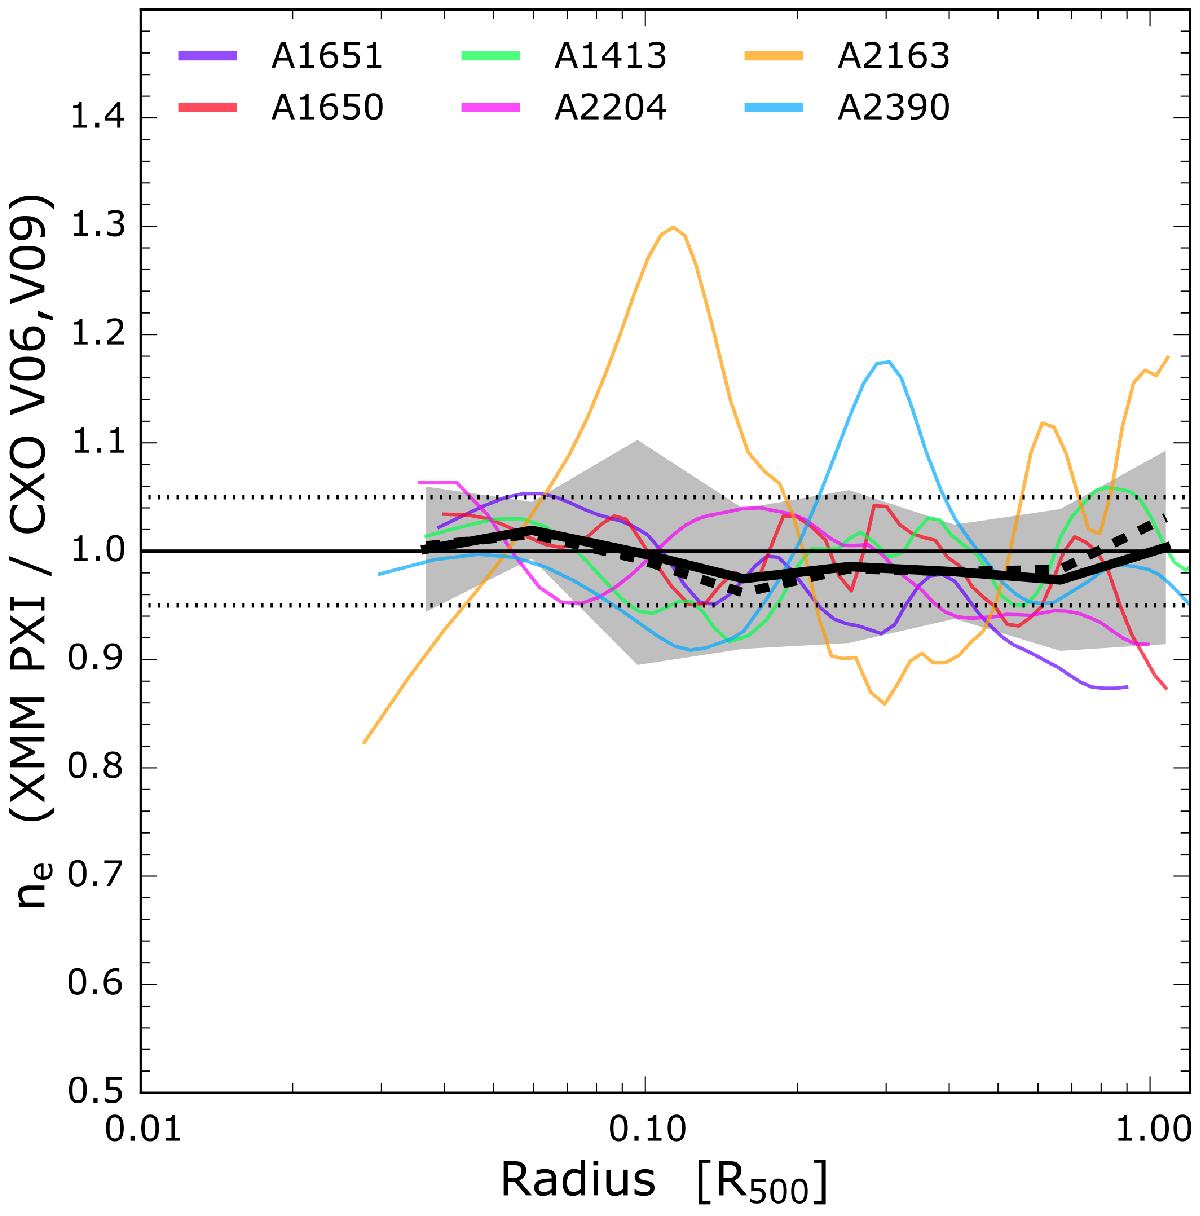
Ratio of XMM-Newton and Chandra gas density profiles published by Vikhlinin et al. (2006, 2009a) and Planck Collaboration XI (2011; PXI), obtained using independent analysis techniques. The XMM-Newton and the Chandra profiles are derived from deprojection and parametric model fitting, respectively. The vignetting correction method is different (see text). The point source and substructure masking and centre choices are also independent. The black solid (dashed) line represents the median (weighed mean) and the grey shaded area its 1σ confidence level. The dotted horizontal lines represent the ± 5% levels. At large scale the profiles show good agreement in the shape, with an average offset of ~2%. In the inner regions differences are dominated by the choice of the centre. The difference between the centres ranges from 1 to ~14 arcsec (<0.02 R500 in all cases).
Current usage metrics show cumulative count of Article Views (full-text article views including HTML views, PDF and ePub downloads, according to the available data) and Abstracts Views on Vision4Press platform.
Data correspond to usage on the plateform after 2015. The current usage metrics is available 48-96 hours after online publication and is updated daily on week days.
Initial download of the metrics may take a while.